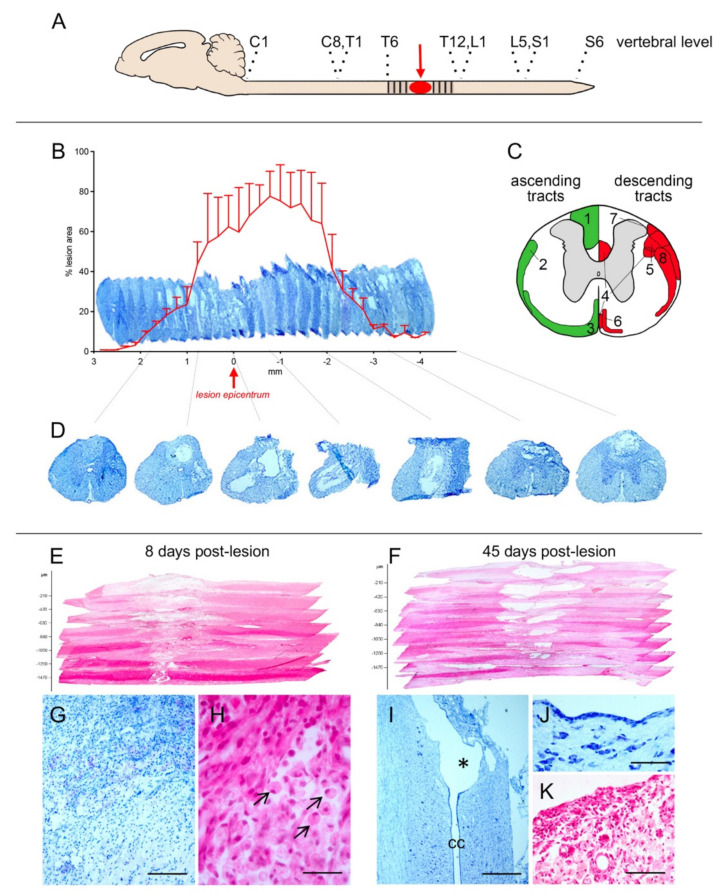
Figure 2.
Anatomical analysis of the contusion model used in this study. (A) The epicenter of the impact (red) and the sampled area (dashed) are indicated. (B) 3D representation and quantitative evaluation of the lesion at 45 days post lesion (DPL), as performed in toluidine blue stained coronal sections. (C) Schematic representation of ascending (green) and descending (red) tracts in the Spinal Cord at T9. The numbers refer to the tracts, as follow: 1 dorsal column; 2 spinocerebellar; 3 spinothalamic; 4 corticospinal; 5 rubrospinal; 6 vestibulospinal; 7 reticulospinal; 8 raphespinal, (D) representative coronal sections all along the sampled rostro-caudal extension obtained from a sample animal. (E,F) 3D representation of the lesion d segments, as performed by HE staining on horizontal section at 8 (E) and 45 (F) DPL. (G–K) high power micrographs of the lesioned areas, illustrating the severe inflammatory cellular infiltrate (G) also enriched by gitter cells (marked by black arrows in (H)) at 8 DPL; the cavitation communication with the central canal (marked by * in (I)), respective ependymal-like lining layer (J), and persistence of the inflammatory cellular infiltrate (K) at 45 DPL. Bars: G 100 µm; I 25 µm; K 250 µm; J, K 200 µm.

