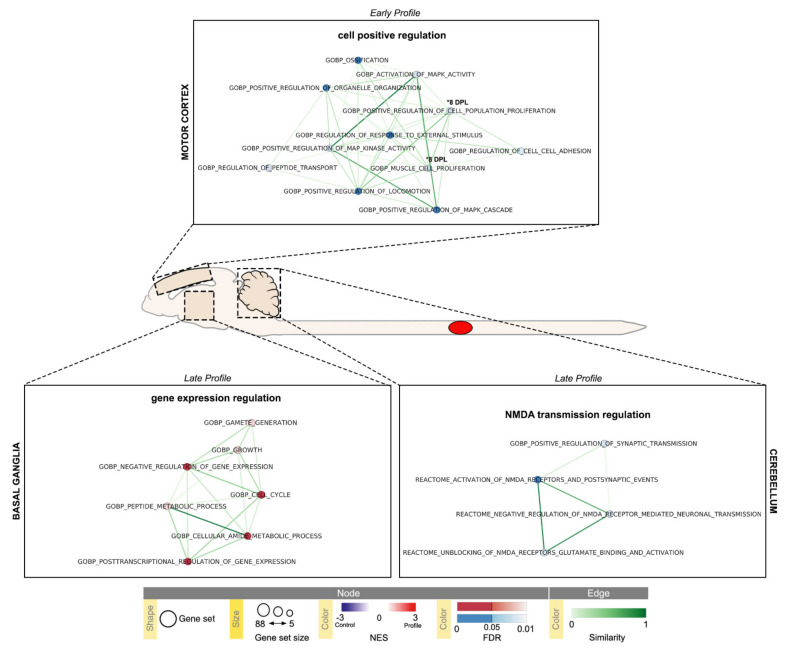
Figure 7.
Time-series Gene Set Enrichment Analysis (GSEA) of cerebral Motor Cortex (CTX-M), Basal Ganglia (BG) and Cerebellum (CB) visualized using EnrichmentMap Cytoscape App. Results with absolute Normalized Enrichment Score (NES) ≥ 1.5 and False Discovery Rate (FDR) ≤ 0.1 are reported (CTX-M early 1–8 DPL profiles, and late 45 DPL profile, Table 3; BG late 45 DPL profile, Table 4; CB early 8 DPL, and late 45 DPL profiles Table 5); pathways with FDR ≤ 0.05 are highlighted. Temporal profiles are labeled as Early Profile (peak at 1 DPL) and Late Profile (peak at 45 DPL); 8 DPL pathway enrichments are individually marked. Pathways (circles) are connected by edges (lines) based on their similarity score and grouped into labeled clusters using AutoAnnotate application v.1.3.4. Red dots denote positively associated pathways (enriched respect to control, NES ≥ 1.5) and blue dots denote negatively associated pathways (decreased respect to control, NES ≤ −1.5). Edge width denotes overlap between pathways.

