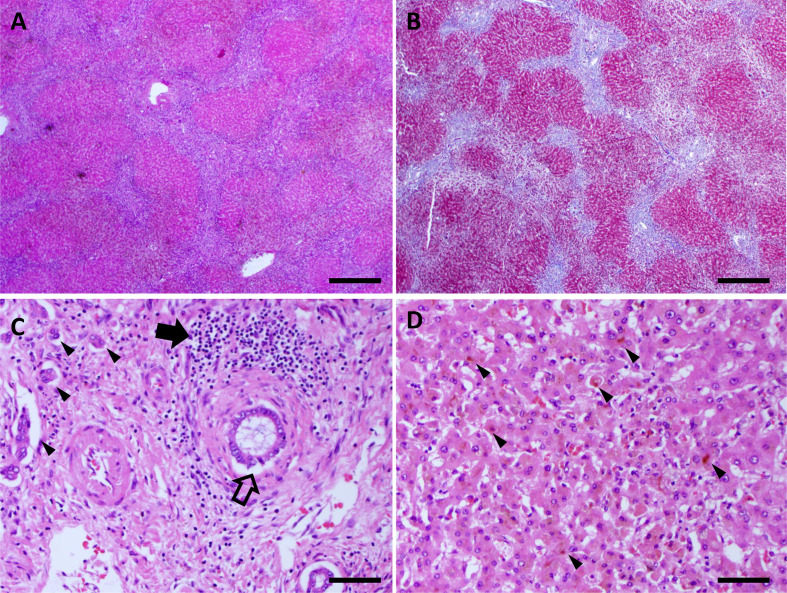
Figure 3.
Explant pathology. (A, B) H&E and trichrome stained slides demonstrating bridging fibrosis. Scale bar is 500 µm. (C) H&E stained slide showing portal tract with severe bile duct injury (open arrow), lymphoplasmacytic infiltrate (filled arrow) and ductular reaction (arrowheads). Scale bar is 50 µm. (D) H&E stained slide showing intracellular cholestasis (arrowheads). Scale bar is 50 µm.

