Figure 1.
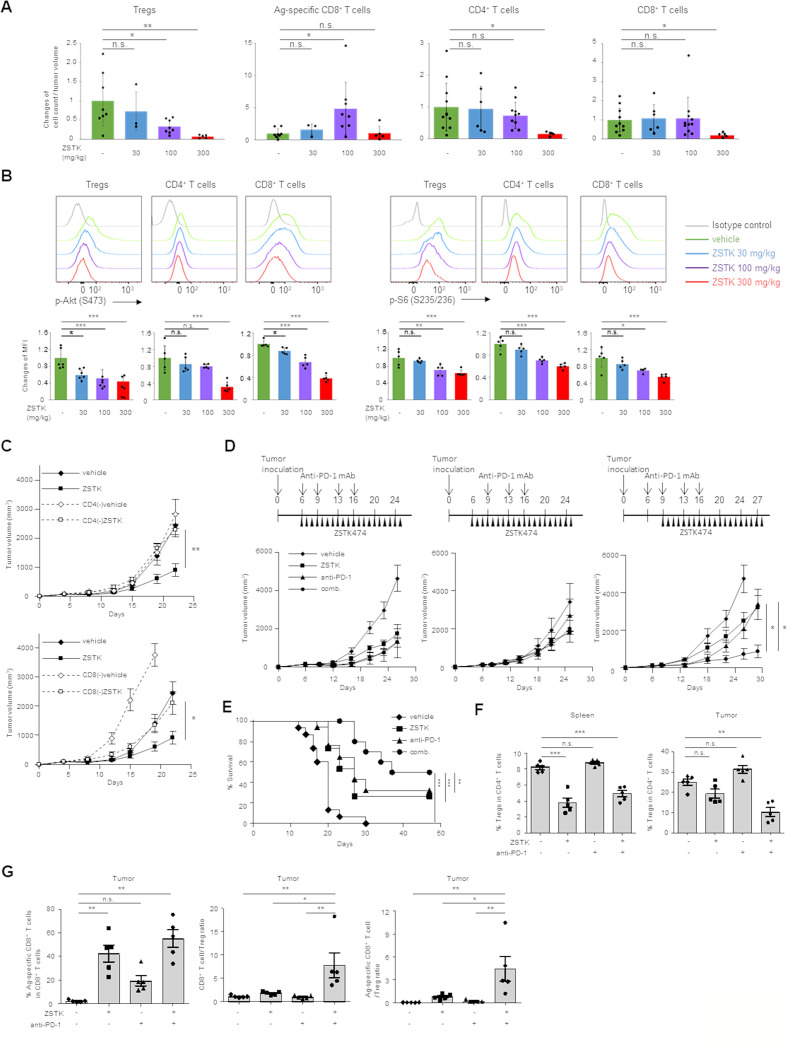
Treatment of ZSTK474 alone or in combination with anti-PD-1 mAb activates antitumor immunity via Treg suppression. (A) The relative changes of intratumoral Treg, tumor antigen-specific CD8+ T cell, CD4+ T cell and CD8+ T cell counts per tumor volume (mm3) by ZSTK474 treatment in mice-bearing CMS5a-NY-ESO-1. ZSTK474 was administrated at 30, 100 or 300 mg/kg once a day from day 6 to 13. T cells were collected from tumors 14 days after tumor inoculation and were subjected to flow cytometry. Data are means±SD. (B) Phosphorylation status of Akt at S473 (p-Akt) and S6 at S235/236 (p–S6) in Tregs, helper CD4+ T cells and CD8+ T cells in DLNs of mice-bearing CMS5a-NY-ESO-1 treated with ZSTK474 at 30, 100 or 300 mg/kg once a day from day 6 to 12. DLNs were collected from mice 2 hours after the last administration and T cells in DLNs were subjected to flow cytometry. Representative flow cytometry histograms (upper panels) and summaries of mean fluorescence (MFI) of p-Akt and p-S6 in Tregs, helper CD4+ T cells and CD8+ T cells are shown. (C) Tumor growth inhibition of CMS5a-NY-ESO-1 tumors by ZSTK474 treatment (n=6 per group) in CD4+ or CD8+ T cell-deleted mice. (D) Antitumor effects of the combination therapy with ZSTK474 and anti-PD-1 mAb (three different protocols) in CMS5a-NY-ESO-1 model (n=8 per group). ZSTK474 and anti-PD-1 mAb were administered as shown in each upper panel. (E) Survival curves of CMS5a-NY-ESO-1-bearing mice treated with or without ZSTK474 (once a day from day 9 to 28) and/or anti-PD-1 mAb (day 6, 9, 13 and 16). (F, G) Mice-bearing CMS5a-NY-ESO-1 were treated with or without ZSTK474 (once a day from day 9 to 15) and/or anti-PD-1 mAb (day 6, 9 and 13). T cells were collected from spleens and tumors at 16 days after tumor inoculation and were subjected to flow cytometry. The frequencies of Tregs in CD4+ T cells in spleens (left) and tumors (right in F), the frequencies of NY-ESO-1 specific CD8+ T cells (left), CD8+ T cell:Treg ratio (middle) and NY-ESO-1-specific CD8+ T cell:Treg ratio (right in G) in tumors. Data are means±SE. Statistical analyses were performed by Dunnett’s test (A, B, D, F, G), Student’s t-test (C) and Gehan-Breslow-Wilcoxon test (E). These experiments were performed independently at least two to three times with similar results. *P<0.05; **p<0.01; ***p<0.001. DLNs, draining lymph nodes; mAbs, monoclonal antibodies; ns, not significant; Treg, regulatory T cells.

