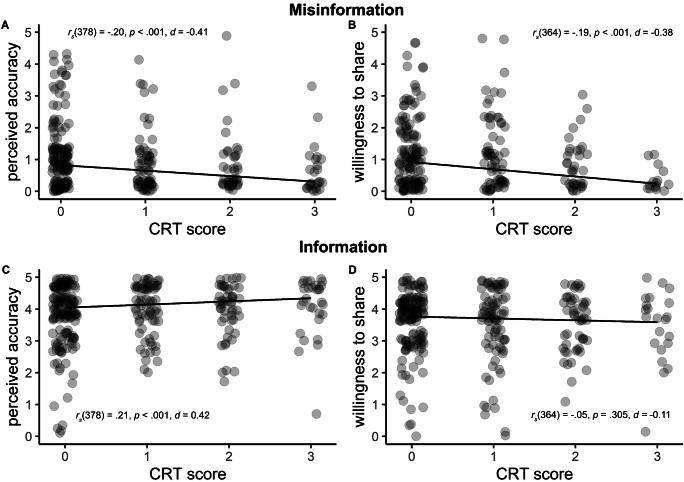
Fig. 1.
Associations between CRT and perceived accuracy and the willingness to share. Note. Each dot represents an individual participant. The value on the accuracy scale shows how many items (out of five) the participant rated as accurate. The value on the willingness to share scale shows how many items (out of five) the participant indicated they were willing to share.

