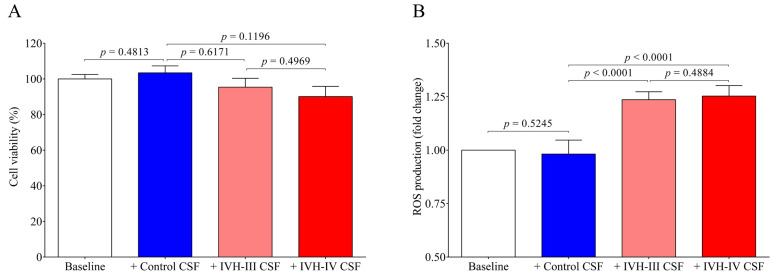
Figure 5.
Cell viability test and the detection of ROS production induced by ex vivo CSF samples obtained from IVH-III (light red) patients, IVH-IV (red) patients, or non-IVH clinical controls (blue). In the cell viability assay (A), HCPEpiCs were treated with ex vivo CSF samples (10 v/v %) for 24 h, followed by an MTT-based cell viability test. Results were shown as a percentage of viability of vehicle-treated (baseline, clear column) cells. (B) Confluent HCPEpiCs were exposed to vehicle non-IVH CSF, IVH-III, or IVH-IV CSF samples (10 v/v %) for 4 h and ROS production was measured after every 30 min using the CM-H2DCFDA assay for 3 h. The graphs show the ROS production at the 60 min time point expressed in fold change (B). Mean ± SEM values are depicted, n = 7–8/group. The ANOVA test with Bonferroni’s multiple comparison test was used for the comparisons. Abbreviations: CSF, cerebrospinal fluid; CM-H2DCFDA, General Oxidative Stress Indicator assay; HCPEpiCs, human choroid plexus epithelial cells; IVH, intraventricular hemorrhage; MTT, Thiazolyl Blue Tetrazolium Bromide; and ROS, reactive oxygen species.

