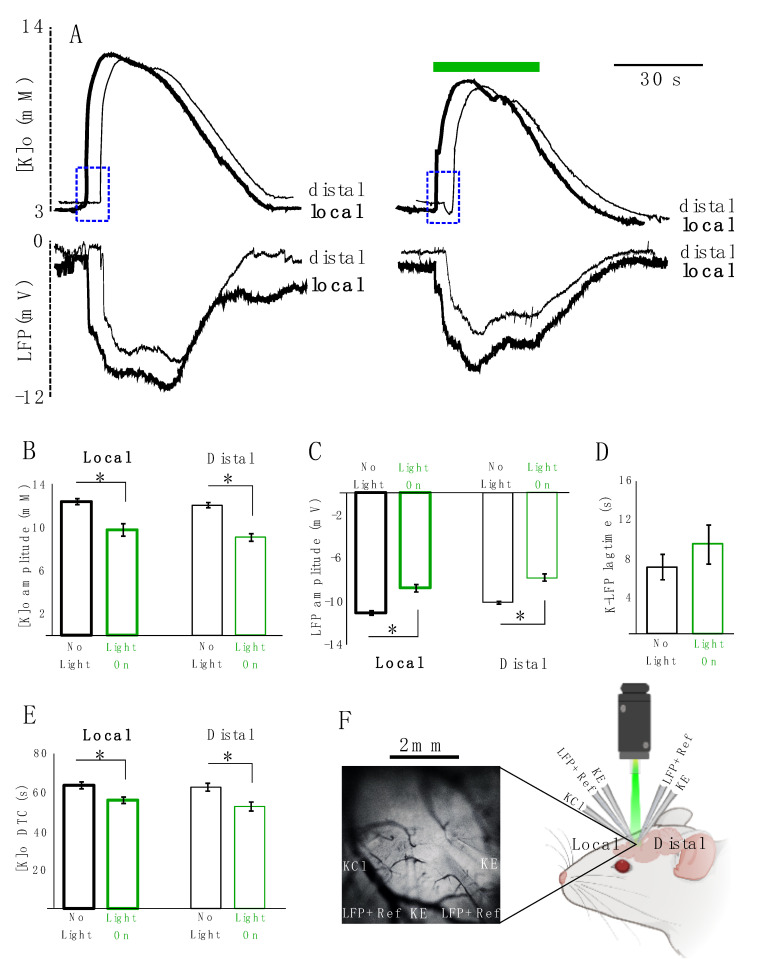
Figure 4.
KCl-evoked K responses decreased in amplitude and DTC locally and distally. (A) Local and distal coupled K-LFP evoked responses: thick lines represent local responses (in the vicinity of the KCl injection site), thin lines represent distal response (~2 mm away from the injection site). Left: responses in the absence of light. Right: response in the presence of light. Top: [K]o responses. Bottom: LFP responses following KCl injection. (B) Summary of local and distal changes in the [K]o amplitude. (C) Summary of changes in the LFP amplitude locally and distally. (D) summary of changes in the lag time of the K-LFP spreading response traveling from the local to distal site indicated in dotted blue rectangles. (E) Summary of changes in the local and distal DTC. Black is in the absence of light and green is when the transfected tissue is exposed to green light illumination. “*’’ represents significance (p < 0.05). (F) Right: experimental configuration: 2 sets of coupled KE-LFP recording electrodes were placed about 2 mm apart from one another, and a KCl injection electrode (KCl) was implanted in the vicinity of one of the KE-LFP electrodes (local site). K-sensitive recording electrode (KE). Local field potential recording electrode along with a local reference electrode for KE (LFP + Ref). Left: in vivo electrodes setting implanted in the transfected area expressing eYFP (n = 5).

