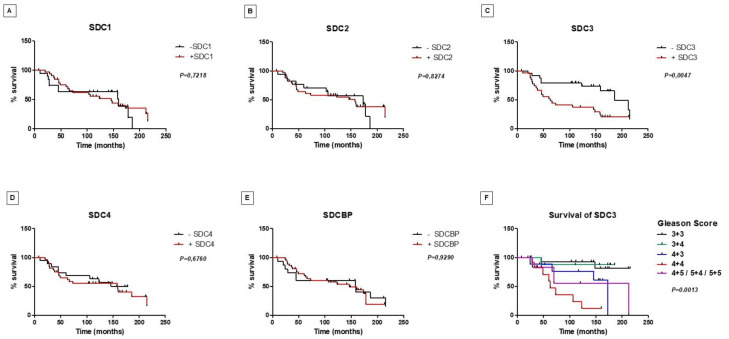
Figure 5.
Prostate-specific survival of patients with prostate cancer regarding syndecans and syntenin-positive and -negative tissue protein immunostaining. Kaplan–Meier curves for survival to SDC1 (A), SDC2 (B), SDC3 (C), SDC4 (D), and SDCBP (E). Note the reduced survival of patients with positive immunostaining for SDC3, p = 0.0047. (F) Stratification of patients positive for SDC3 by Gleason score. SDC3 positive staining revealed lowest prostate-specific survival for patients with 4 + 4 Gleason score (p = 0.0013).

