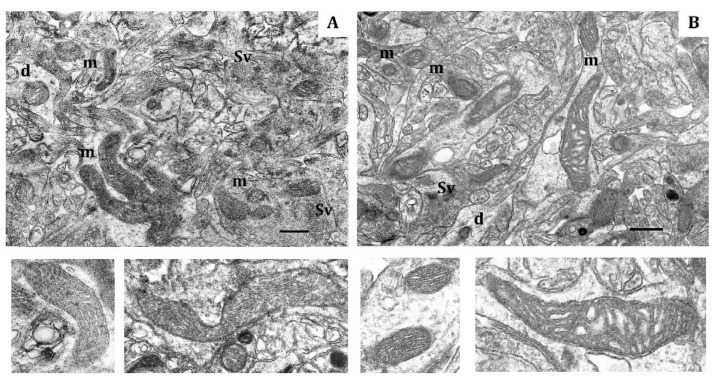
Figure 5.
Electron micrograph showing the effect of long-term hypobaric hypoxia (HBH-10% O2) on mitochondria of the rat cerebral cortex. (A) rats with low resistance to hypoxia; (B) rats with high-resistance to hypoxia. Scale bar: 0.5 μm. For other designations, see legends to Figure 1.

