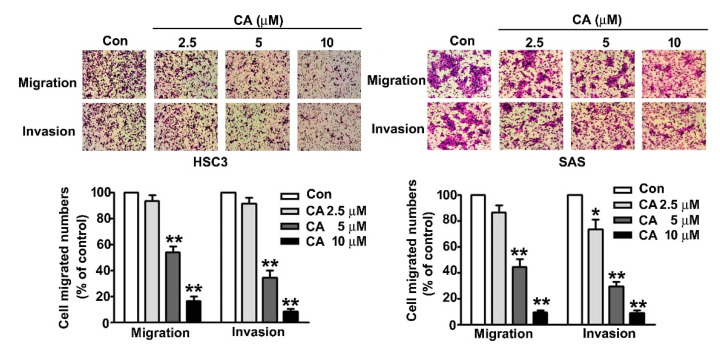
Figure 3.
Effect of CA on cell migration and invasion of human HSC3 and SAS OSCC cells. Human HSC3 and SAS cells were treated with various concentrations of CA (0, 2.5, 5 and 10 μM) for 24 h, and then, capacities of cellular migration and invasion were measured. *, p < 0.05, **, p < 0.01 vs. control (line 1), (Mean ± SE, n = 3). Control: untreated cells. Scale bars: 50 μm.

