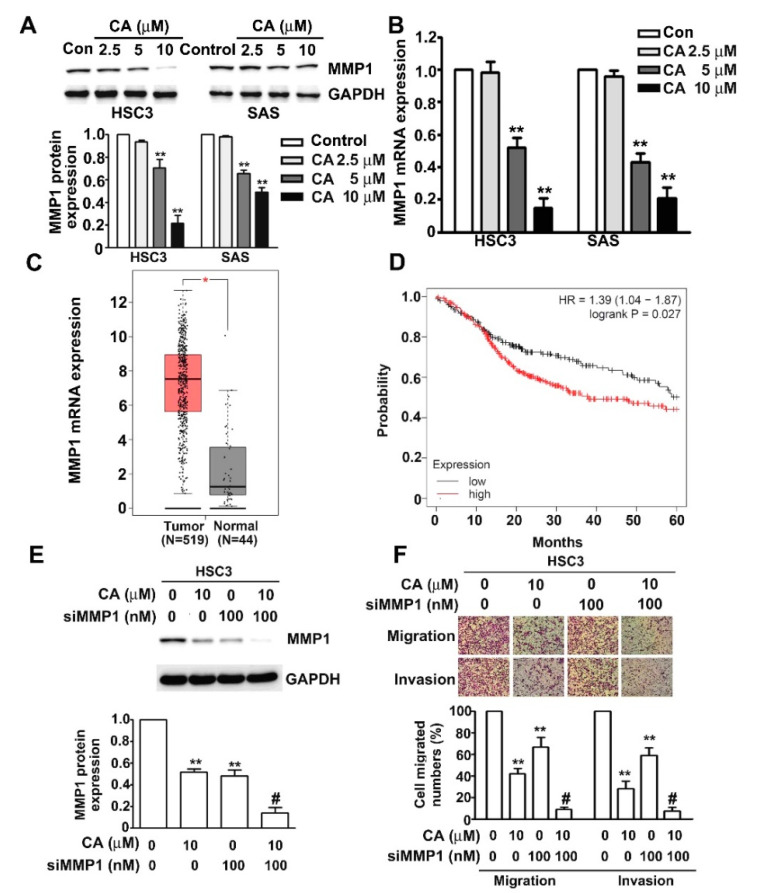
Figure 4.
Effect of CA on MMP1 expression and cell invasion in human HSC3 and SAS OSCC cells. (A,B) Human HSC3 and SAS cells were treated with various concentrations of CA (0, 2.5, 5, 10 or 20 μM) for 24 h, after which the protein and mRNA expression of MMP1 was measured via immunoblotting and qRT-PCR analysis. (C) MMP1 mRNA expression in the matched OSCC tissues and normal tissues was validated from the GEPIA databases. T: Tumour tissue (n = 519); N: Normal tissue (n = 44). *, p < 0.05 versus normal tissue. (D) The red line indicates high MMP1 expression, and the black line indicates low MMP1 expression. (E,F) Human HSC3 cells were treated with CA (10 μM), siMMP1 (100 nM) or CA (10 μM) plus siMMP1 (100 nM); then, MMP1 protein expression, migration and invasion were measured. GAPDH as a protein-loading control. **, p < 0.01 versus control (line 1), #, p < 0.05 vs. CA (line 2) or siMMP1 (line 3). Control: untreated cells. Scale bars: 50 μm.

