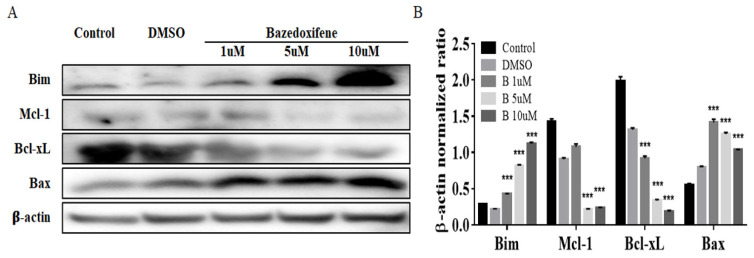
Figure 4.
Expression analysis of apoptosis marker proteins in Bazedoxifene-treated SiHa cells. (A) Cells were treated for 48 h with the indicated doses of Bazedoxifene. Cell extracts prepared after treatment were resolved by SDS-PAGE and analyzed by Western blot analysis with antibodies against the indicated proteins. (B) The band intensities were quantitated. The loading control was β-actin. Bars indicate mean ± standard deviation of three independent experiments performed in triplicate (***, p < 0.001 vs. control). B: Bazedoxifene.

