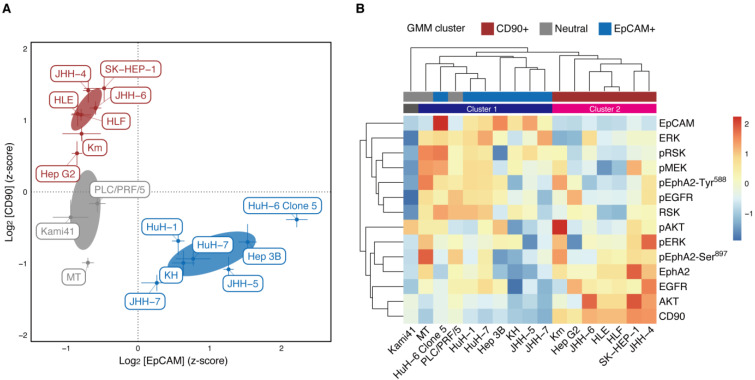
Figure 1.
Clustering of 17 HCC cell lines with protein expression and phosphorylation. (A) GMM clustering of the cell lines based on the RPPA analysis of EpCAM and CD90. A VEV model (ellipsoidal, equal shape) with three components (clusters) was selected using BIC. The clusters are colored by red (CD90+), blue (EpCAM+) and grey (Neutral). Each point is the mean of six replicates. Error bars represent the SDs. Error ellipses denote the 1 σ regions of mixture Gaussian components. (B) Heat map and hierarchical clustering of the cell lines and all the RPPA analysis. Average linkage and Euclidean distance were used to create the dendrograms. The clustering result is depicted by colored bars (dark blue, Cluster 1; magenta, Cluster 2). The GMM clusters are also depicted by bars with the same color as (A).

