
Figure 4. A cross-sectional contour representing an example participant’s deformed skin surface is overlaid with points of intersection obtained separately via the ellipse method fitted to the 3-D point cloud.
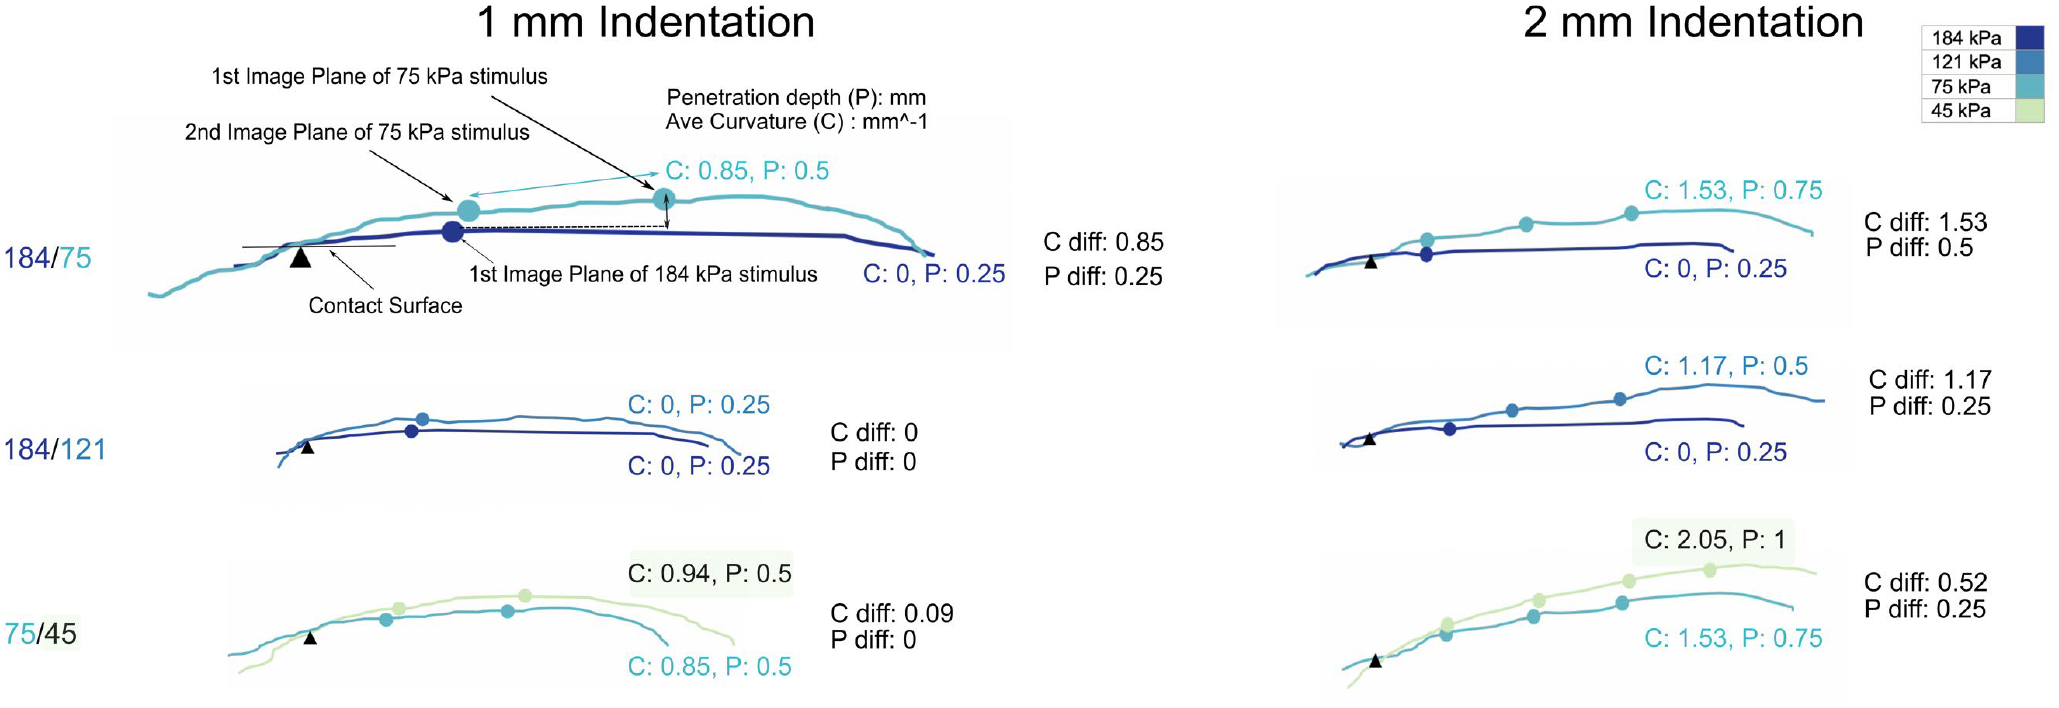
Cross-sectional contours of the deformed skin surface are combined with image planes at points both 1 mm and 2 mm into the 5 mm displacement for three different pairs of compliances. Dots on each contour line represent corresponding image planes at that cross-sectional position. The rightmost dot is the first image plane in all subplots, representing the image plane at the deepest penetration depth. For each stimulus is shown its maximum penetration depth (P) and average curvature (C). The difference between these metrics, for stimulus pairs, are shown as P diff and C diff. For stimuli readily differentiable, e.g., 184 and 75 kPa, P diff and C diff values are distinct almost immediately into the displacement at 1 mm, and become more distinct with greater displacement.