
Figure 5. Comparison of five spatial biomechanical metrics between five compliant substrates.
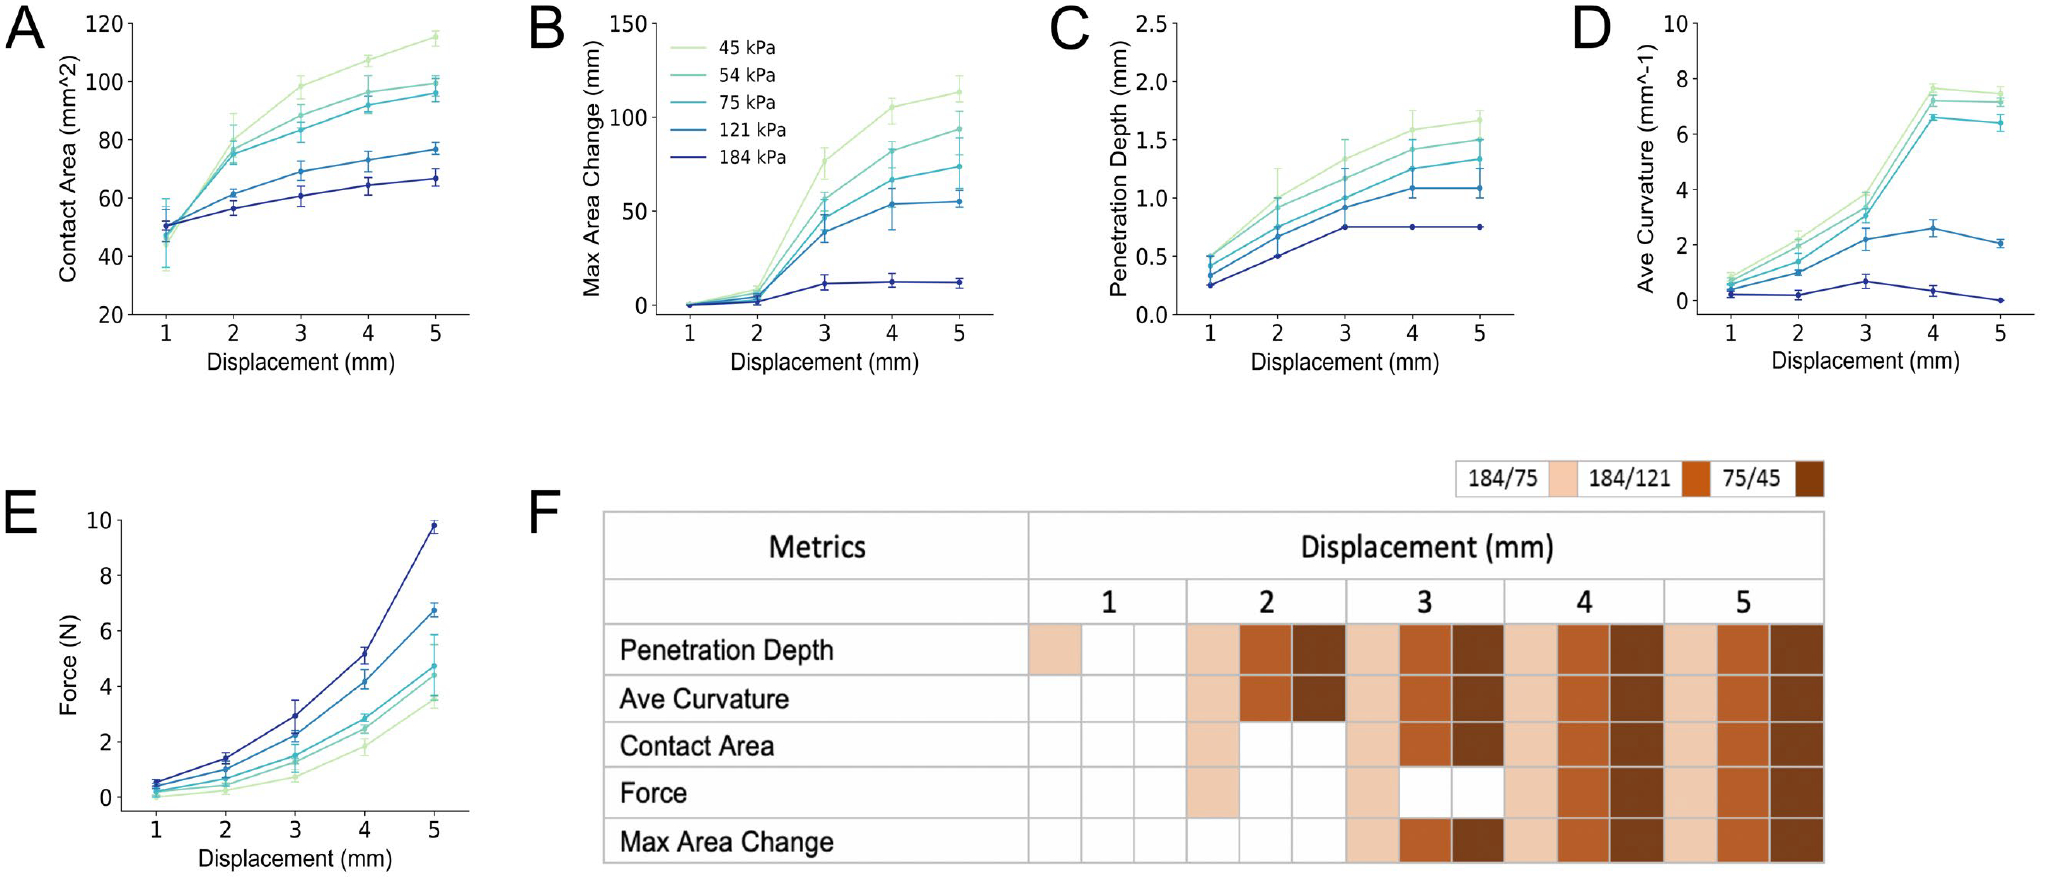
Each metric is defined in Methods. The metrics are each plotted at points from 1–5 mm into the 5 mm terminal displacement. A) The contact area is represented by the last formed ellipse, at the initial surface contact plane, which is always the largest ellipse. B) The maximum area change is the largest difference in area between two sequential (adjacent) image planes, divided by the distance between the two image planes. C) The penetration depth of the finger pad into the stimulus. D) The average curvature is average of all slope values between adjacent image planes. E) The force as measured at the stimulus. In panel F), the metrics are statistically compared (via t-test, significance shown as filled box if more than one standard deviation) across three pairs of stimuli, which vary in discriminability (see Figure 2). As can be observed, penetration depth is distinct at 1 mm into the 5 mm displacement for the 184 to 75 kPa comparison. At 2 mm, additional metrics of contact area, average curvature and force are now distinct. For each stimulus comparisons, even that of 75 to 45 kPa that is difficult to discriminate, penetration depth and average curvature are distinct by 2 mm.