Figure 3.
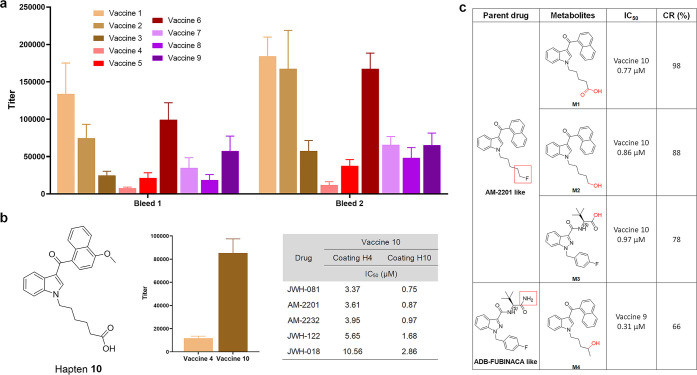
Immune response of screening vaccines. (a) Midpoint titers of vaccines 1–9, using sera from vaccinated mice (n = 6/group) on days 21 (bleed 1) and 35 (bleed 2). All bars are shown as mean ± SEM. (b) Structure of optimized hapten 10. Titer comparison of vaccines 4 and 10 from second bleeding, and effects of two different coatings on drug IC50 of vaccine 10 antisera. Assays are run using mice sera pooling from whole vaccine groups (n = 6). (c) Metabolism patterns of two types of synthetic cannabinoids. Affinity are measured in vaccine 9 or 10 with cross reactivity calculated relative to JWH-081 or ADB-FUBINACA in Table 1.

