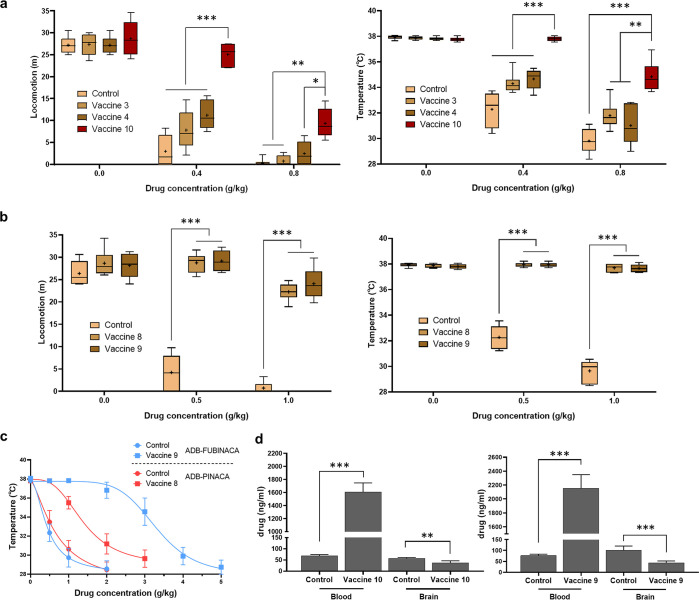
Figure 4.
Vaccine efficacy by intraperitoneal drug administration. Behavior results in mice locomotion and body temperature of vaccines 3, 4, and 10 (a) and vaccines 8 and 9 (b), compared to the KLH vaccinated control mice. Mice accepted i.p. injection of each drug twice with different doses at 1 week intervals. Data are shown as median with quartiles ±10–90% CI (n = 6); +, mean. Significance is denoted by asterisks determined by repeated-measures two-way ANOVA, Tukey multiple comparison test (***P < 0.001, **P < 0.01, *P < 0.05). (c) Cumulative dose curve of drug effects on temperature. Mice of vaccines 8 and 9 were given ADB-PINACA and ADB-FUBINACA, respectively, and compared to KLH vaccinated control mice. Repeated administrations and temperature measurements were performed at 15 min intervals. Symbols are shown as mean ± SEM, (n = 6). Nonlinear regression fit (inhibitor vs response, variable slope, 4 parameters, IC50 = 0.44, 0.57, 1.40, 3.65 g/kg from low to high). (d) Blood-brain biodistribution of vaccines 10 and 9 vaccine groups using AM-2232 and ADB-FUBINACA as drug surrogates. All bars are shown as mean ± SEM (n = 6). Significance is denoted by asterisks determined by unpaired t test (***P < 0.001, **P < 0.01).

