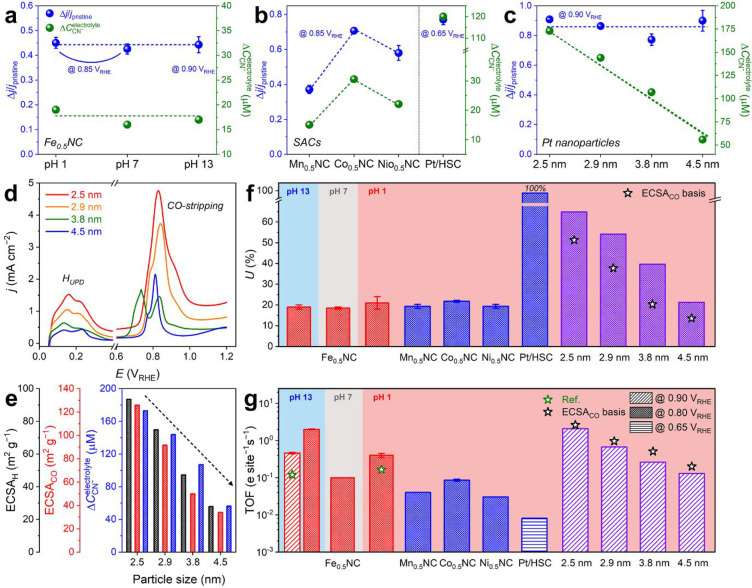
Figure 4.
General applicability of cyanide-poisoning in situ SD quantification protocol. (a–c) Δj/jpristine and ΔCCN–electrolyte values obtained after the in situ SD quantification of Fe0.5NC at various pH values (a), Me0.5NC (Me = Mn, Co, and Ni) and Pt/HSC (b), and Pt nanoparticles with different particle sizes (i.e., 2.5, 2.9, 3.8, and 4.5 nm) (c). (d) HUPD and CO-stripping voltammograms of Pt nanoparticles. (e) Comparison between ECSA values, derived from HUPD (black y-axis) and CO-stripping (red y-axis), and ΔCCN– (blue y-axis) for Pt nanoparticles with different particle sizes. (f,g) Summary of U (f) and TOF (g) values estimated by the in situ SD quantification of Fe0.5NC at various pH values and other control SACs and Pt nanoparticles at pH 1. The values reported in the literature (green star) or obtained by ECSACO (black star) are also included for comparison.26,33

