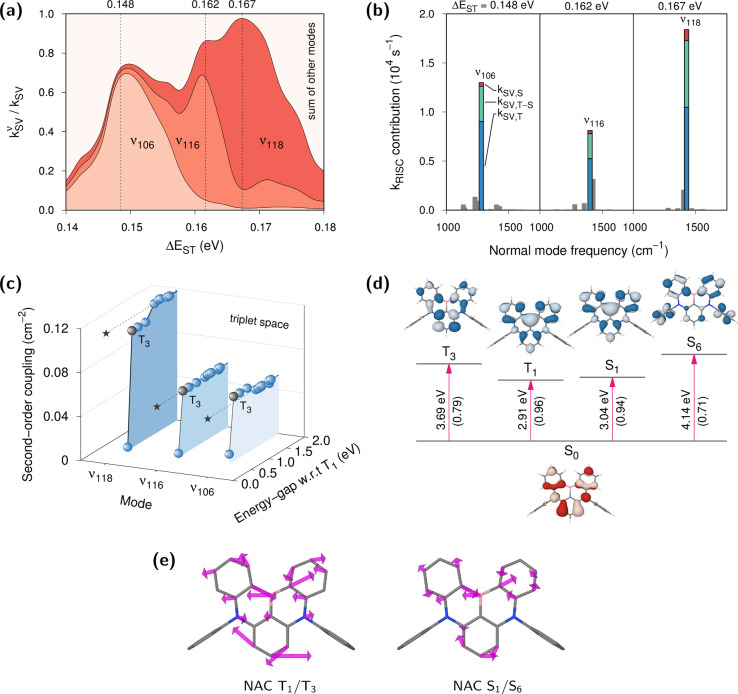
Figure 3.
Analysis of kRISC in DABNA. (a) Contributions
by vibrational modes with strong resonance enhancements, namely ν106, ν116, and ν118. The
ΔEST values at which  become maxima are marked as vertical lines.
(b) Contributions by each vibrational mode to kSV at the vertically marked energies in a. The contribution
is further partitioned into spin-manifold components according to eq 4. (c) Convergence profiles
of the sum-over-electronic-states expansion for each mode in the triplet
manifold. Similar profiles in the singlet manifold are provided in Figure S1. Here, the excited state with a dominant
contribution (T3) can be easily identified as marked with
gray spheres. Convergence was reached with 20 excited states as denoted
with dashed lines and stars. The T1 energy was used as
the zero energy reference. (d) Natural transition orbital pairs from
the ω*B97X calculations at the S1 geometry. Hole
(red) and particle (blue) wave functions are represented by frontier
orbitals with the largest weights, shown in parentheses. The S1 and the T1 energies are from the SCS-CC2 level
calculations. (e) Nonadiabatic T1–T3 and
S1–S6 coupling vectors responsible for
RISC.

