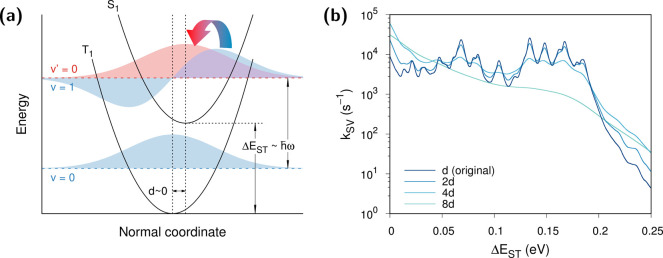
Figure 6.
Mechanism of vibrational enhancement of RISC. (a) Schematic representation
of the vibronic spin-flip transition. The vibrational wave functions
are illustrated with filled curves (T1, blue; S1, red). (b) Displacement dependence of the second-order (spin–vibronic)
RISC rates at varying ΔEST as measured
by fortuitously increasing the original displacement vector  by some integers,
  . See SI Text 1 for the mathematical formulation of
  .
.

