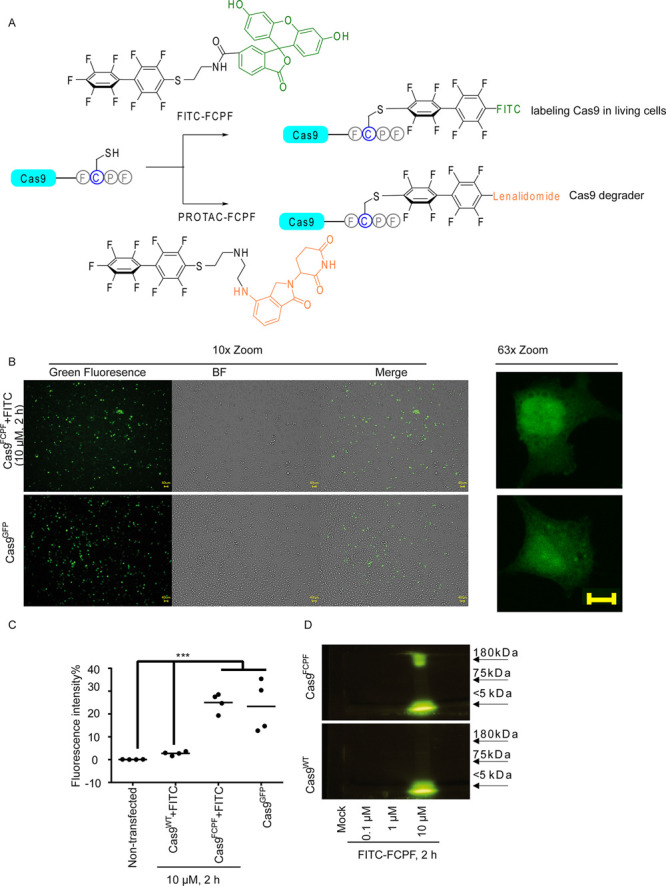
Figure 1.

The application of Cas9FCPF for live cell imaging. (A) Overview of applications of Cas9FCPF for labeling (FITC-FCPF, green) and degradation (PROTAC-FCPF, orange). (B) Green fluorescence signal is detected in FCPF-FITC-treated HeLa cells expressing Cas9FCPF. HeLa cells expressing Cas9FCPF were treated with FITC-FCPF (10 μM) for 2 h. Cas9GFP was used as a positive control. The fluorescence images (10× and 63× enlarged) were taken from nontransfected cells, FITC-FCPF-treated cells expressing Cas9WT, and nontreated cells expressing Cas9FCPF. Images from Cas9GFP cells and Cas9FCPF cells treated with FITC-FCPF (10 μM, 2 h) were shown. Remaining images can be found in the Supporting Information (Figure S1A). Scale bar: 40 μm. (C) Comparison of fluorescence intensity of FITC-FCPF-treated cells expressing Cas9WT and Cas9FCPF HeLa cells expressing Cas9WT or Cas9FCPF were treated with FCPF-FITC (10 μM) for 2 h, and the fluorescence intensity was analyzed by FACS. Nontransfected cells and cells expressing Cas9GFP were used as negative and positive controls. The results were obtained from four independent biological replications. The center represents the median. Two-way ANOVA was performed. *** p < 0.001. (D) Electrophoresis analysis of FITC-FCPF-treated samples obtained from cells expressing either Cas9FCPF or Cas9WT. HeLa cells expressing Cas9WT or Cas9FCPF were treated with increasing concentrations of FITC-FCPF for 2 h. Proteins collected from a whole cell lysis were dissolved in 8% SDS PAGE. The original pictures with a protein loading marker can be found in the Supporting Information (Figure S1C).
