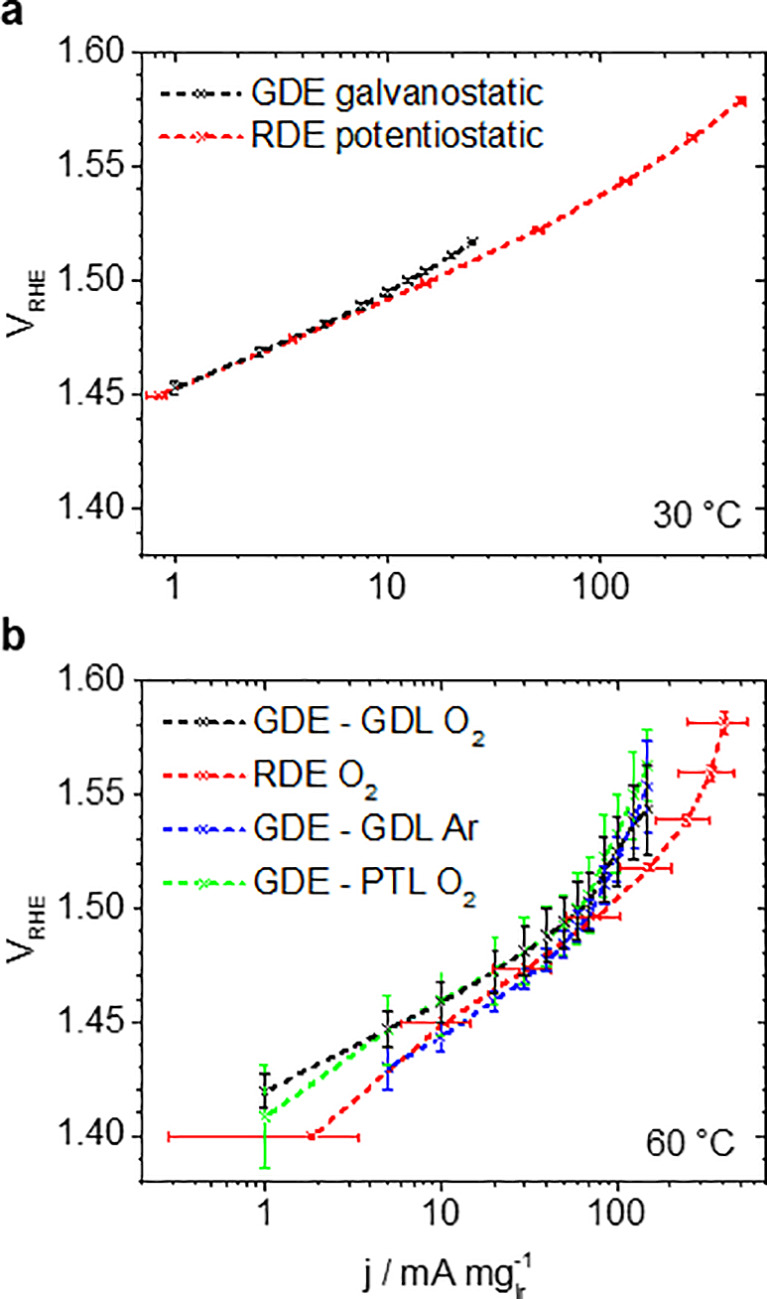
Figure 3.

Tafel plots of OER mass activity j of the IrO2 catalyst. Comparison of GDE (galvanostatic, 4 M HClO4, 1 mgIr cm–2geo) and RDE (potentiostatic in O2 atmosphere, 0.1 M HClO4, 50 μgIr cm–2geo) measurements (a) at 30 °C in O2 and (b) 60 °C using a GDL in O2 and Ar or Ti-PTL in O2 atmosphere in the GDE setup. The error bars show the standard deviation of three independent measurements; the data points are connected by dashed lines as guide for the eye.
