Figure 5.

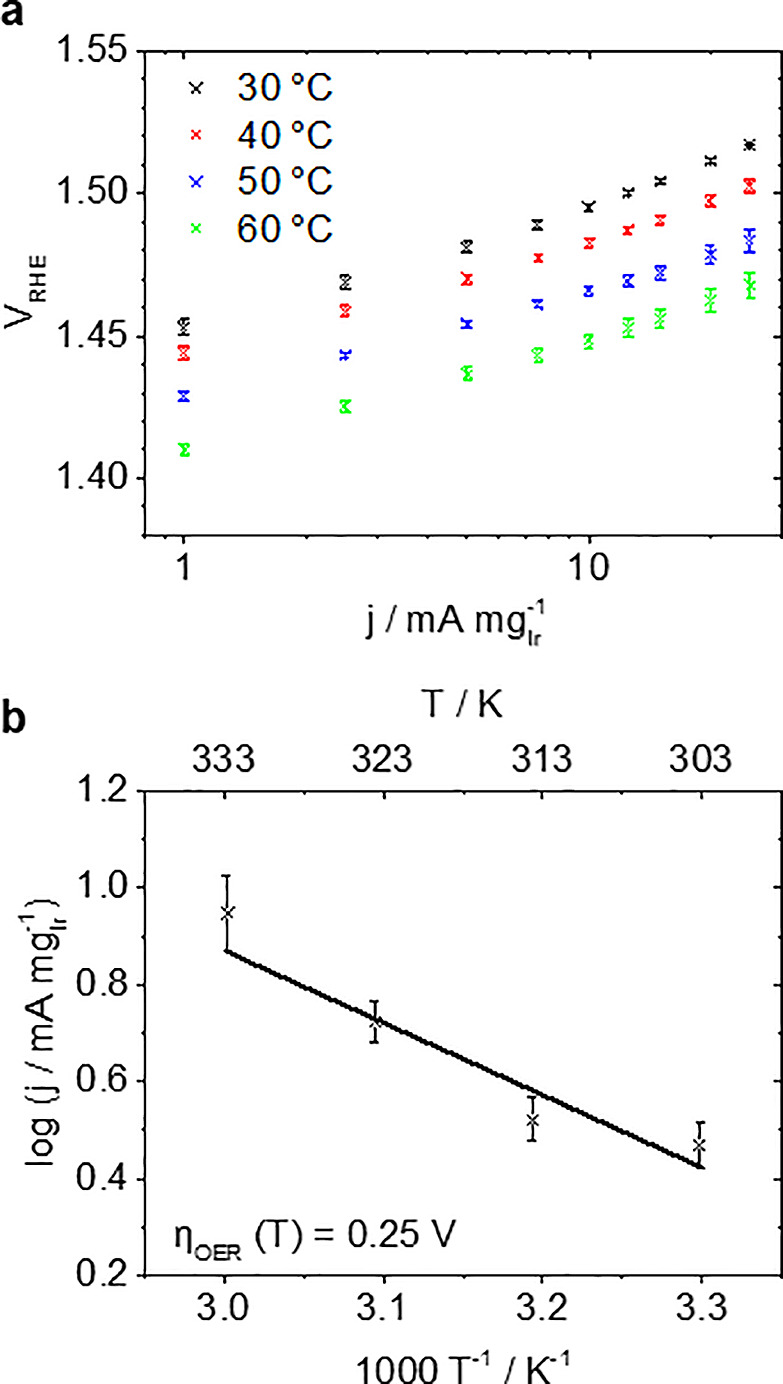
(a) Temperature-dependent OER mass activity j plotted as Tafel plots obtained in a GDE setup applying current steps versus VRHE. (b) The corresponding Arrhenius plot at an overpotential ηOER of 0.25 V.

(a) Temperature-dependent OER mass activity j plotted as Tafel plots obtained in a GDE setup applying current steps versus VRHE. (b) The corresponding Arrhenius plot at an overpotential ηOER of 0.25 V.