
Figure 2.
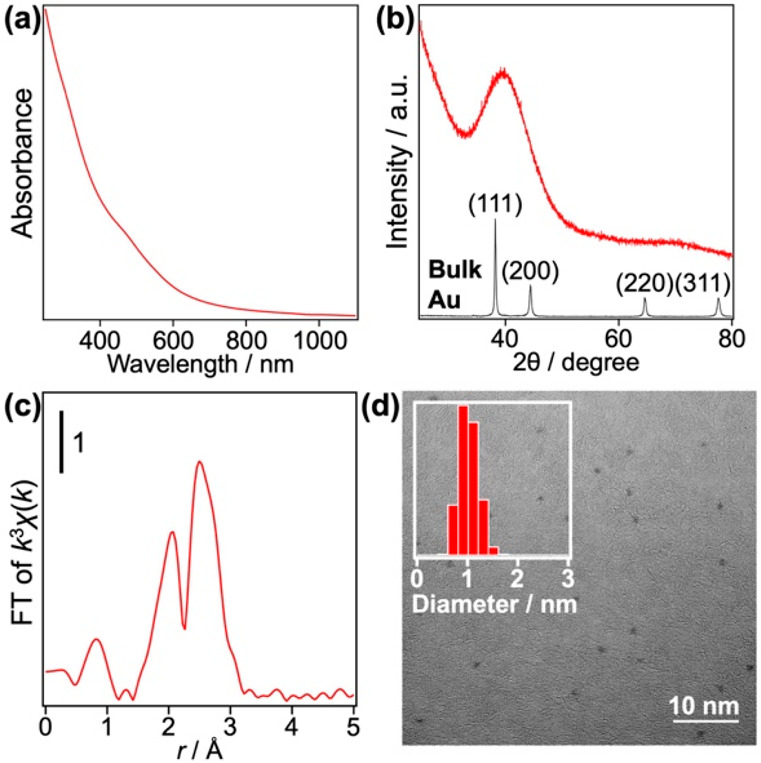
(a) Optical absorption spectrum in water, (b) PXRD pattern, (c) Au L3-edge FT-EXAFS spectrum, and (d) representative ACTEM image with low magnification of Au:PVP (sample c). Results of the curve fitting analysis of Au L3-edge EXAFS are summarized in Table S1 in the Supporting Information. The inset of panel (d) indicates the diameter distribution of 388 randomly chosen particles.