Figure 10.

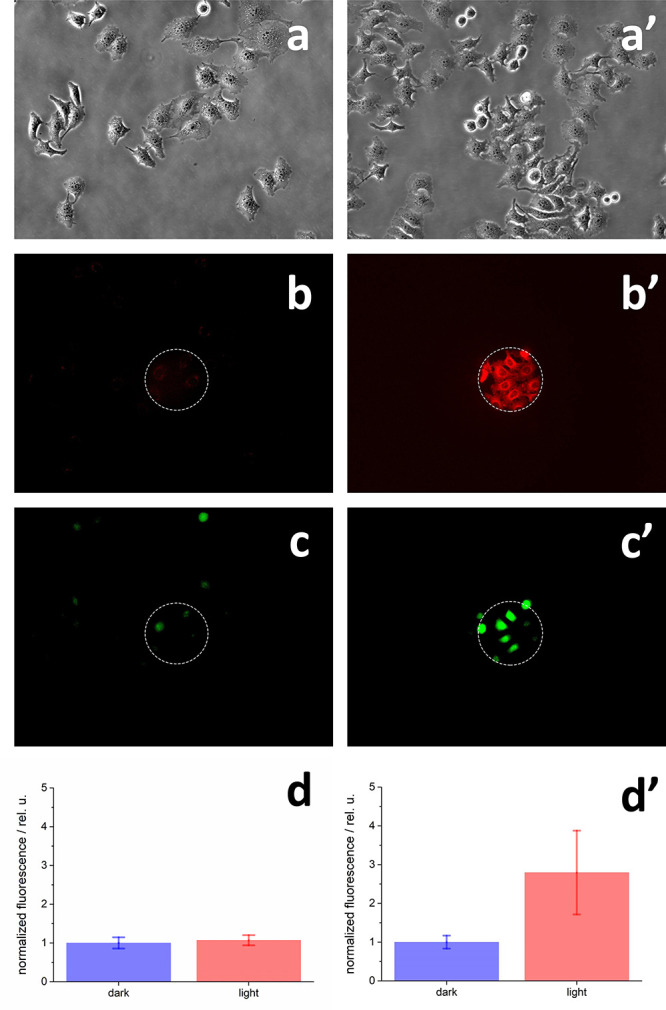
Reactive oxygen species (ROS) production in HeLa cells upon illumination of HSA-3a. (a–d): cells incubated with 100 μM DCHF-DA; (a′–d′): cells incubated with 800 nM HSA-3a and 100 μM DCHF-DA (see Methods for details). (a,a′) HeLa cells before illumination loaded with (a) 100 μM DCHF-DA or (a′) 100 μM DCHF-DA and 800 nM HSA-3a; any dead cell can be detected before localized illumination. (b,b′) 10 s illumination with green light (λexcitation = 532–587 nm, λemission = 608–683 nm). Illumination was confined to the area indicated with the dashed white circle; (c,c′) DCHF-DA fluorescence taken 10 s after 10 s illumination with green light. Images were obtained using a Nikon FITC cubic filter (λexcitation = 465–495 nm, λemission = 515–555 nm; see Methods for more information). Fluorescence images were measured with an intensity scale 1–4092 (12 bit); LUT scales for c and c′ panels were all set with minimum–maximum values of 180–321; (d,d′) quantification of DCHF-DA fluorescence signals for illuminated (light, red) and non-illuminated (dark, blue) cells. Bars and error bars are the average and standard deviation values of mean intensity fluorescence signals as detailed in the Methods section; normalized fluorescence values were obtained by dividing each value for the average fluorescence intensity measured for non-illuminated cells (i.e., cells outside of the white dashed circle of panel b,b′).
