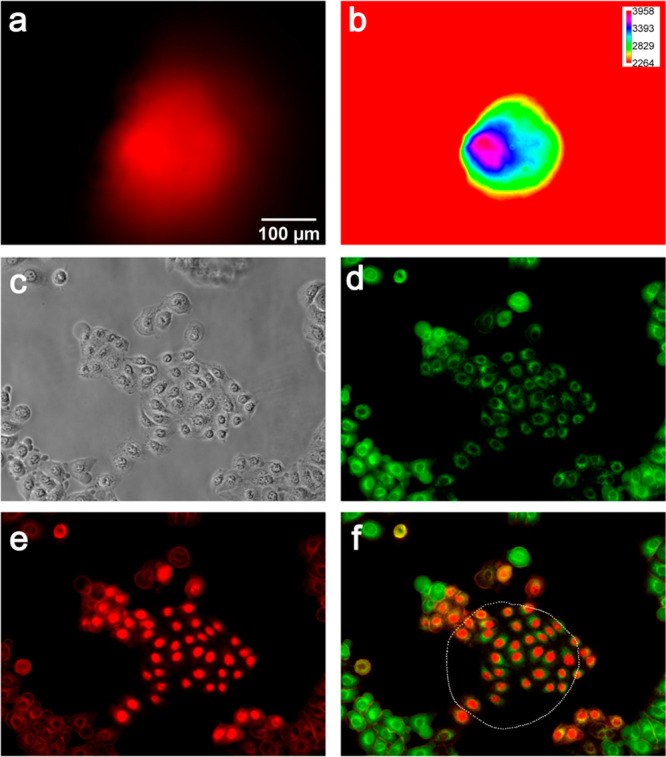
Figure 9.

Localized photokilling of HeLa cells. HeLa cells were irradiated for 10 min with a mercury lamp filtered using a Nikon Texas Red HYQ cubic filter (λexcitation = 532–587 nm, λemission = 608–683 nm; see Methods for details). (a, b) Dimensions of the irradiation spot, represented by a red (a) and by an intensity spectrum (b); the calibration bars of light intensity are reported in relative units. (c) Phase contrast image after irradiation. (d) Green fluorescence (λexcitation = 465–495 nm, λemission = 515–555 nm; see Methods for details) signal is due to the staining of living cells with calcein-AM. (e) Red fluorescence (λexcitation = 532–587 nm, λemission = 608–683 nm) is due to the staining of nuclei of died cells with propidium iodide. (f) Overlay of red (e) and green (d) channels; approximation of irradiation spot boundaries is shown as a white dotted line.
