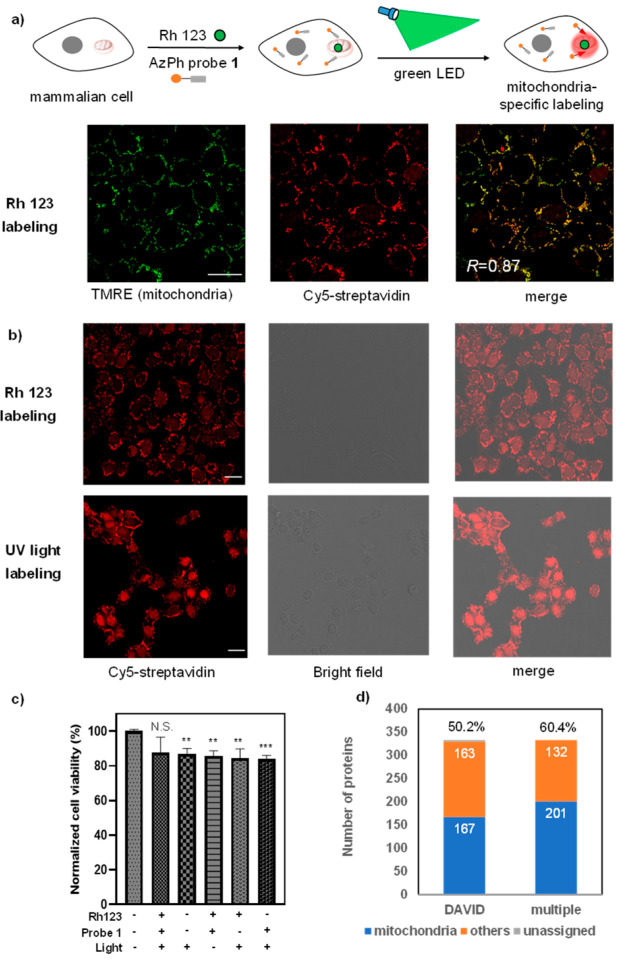
Figure 4.
Photocatalytic labeling of the mitochondrial proteome by AzPh-biotin probe 1 in MCF-7 cells. (a) Photocatalytic mitochondrial proteome labeling scheme and confocal fluorescence microscopy analysis of AzPh-biotin probe 1 with Rh 123 in MCF-7 cells. The green dots represent the organic dye Rh 123, and the red circles represent the mitochondrial proteome labeled in the proximity of Rh 123. Cells were irradiated by the green LED with Rh 123 at 37 °C for 1 h (515 nm, 2.9 mW/cm2). TMRE (green) stains the mitochondria, and Cy5-streptavidin (red) detects the biotinylated proteins. The merged image shows good colocalization (R = 0.87, colocalization was quantified using Pearson’s R-value calculated with Coloc 2 in ImageJ). Scale bar: 20 μm. Rh 123 (20 μM), AzPh-biotin probe 1 (200 μM). (b) Proteome labeling in MCF-7 cells with AzPh-biotin probe 1 by green LED irradiation with Rh 123 for 1 h (515 nm, 2.9 mW/cm2) or UV light irradiation for 20 min (365 nm, 11.8 mW/cm2) at 37 °C. (c) MTT cell viability assay for the cytotoxicity of Rh 123 labeling using AzPh-biotin probe 1 under green LED irradiation at 37 °C for 1 h (515 nm, 2.9 mW/cm2). The statistical significance of the differences between groups was evaluated with the unpaired Student’s t test. A p-value of 0.05 and below was considered significant: p < 0.01 (**), p < 0.001 (***), N.S. is not statistically significant. All p-values were calculated with control cells that treated without light and small molecules. Error bars represent mean ± SD (n = 3). (d) Counts of the photocatalytic labeled MCF-7 mitochondrial proteins by the LC-MS/MS analysis with Rh 123 and the AzPh-biotin probe 1. The annotations were performed by the DAVID (167/333, 50.2%, DAVID) or by the combined databases including DAVID, Uniprot, and MitoCarta 2.0 (201/333, 60.4%, multiple).

