Figure 5.
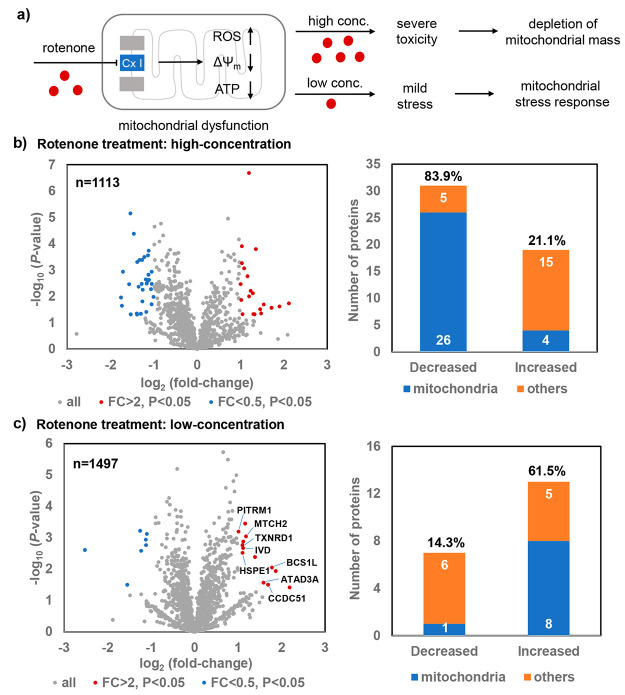
Photocatalytic proteome mapping of the mitochondria for the rotenone-induced stress response. (a) HeLa cells underwent mitochondrial stress response with the mild stress induced by the low-concentration of rotenone, while the depletion of mitochondrial mass was detected with the severe mitochondrial toxicity induced by the high-concentration of rotenone. (b) Volcano plot of the identified proteins by the high concentration (2 μM) of rotenone treatment and the changed protein counts. A significant portion of the decreased protein measurement was observed in mitochondria (26/31, 83.9%). (c) Volcano plot of the identified proteins by the low concentration (0.02 μM) of rotenone treatment and the changed protein counts. A significant portion of the increased protein measurement was observed in mitochondria (8/13, 61.5%). The decreased protein measurement is colored in blue, and the increased protein measurement is colored in red. FC: fold-change.

