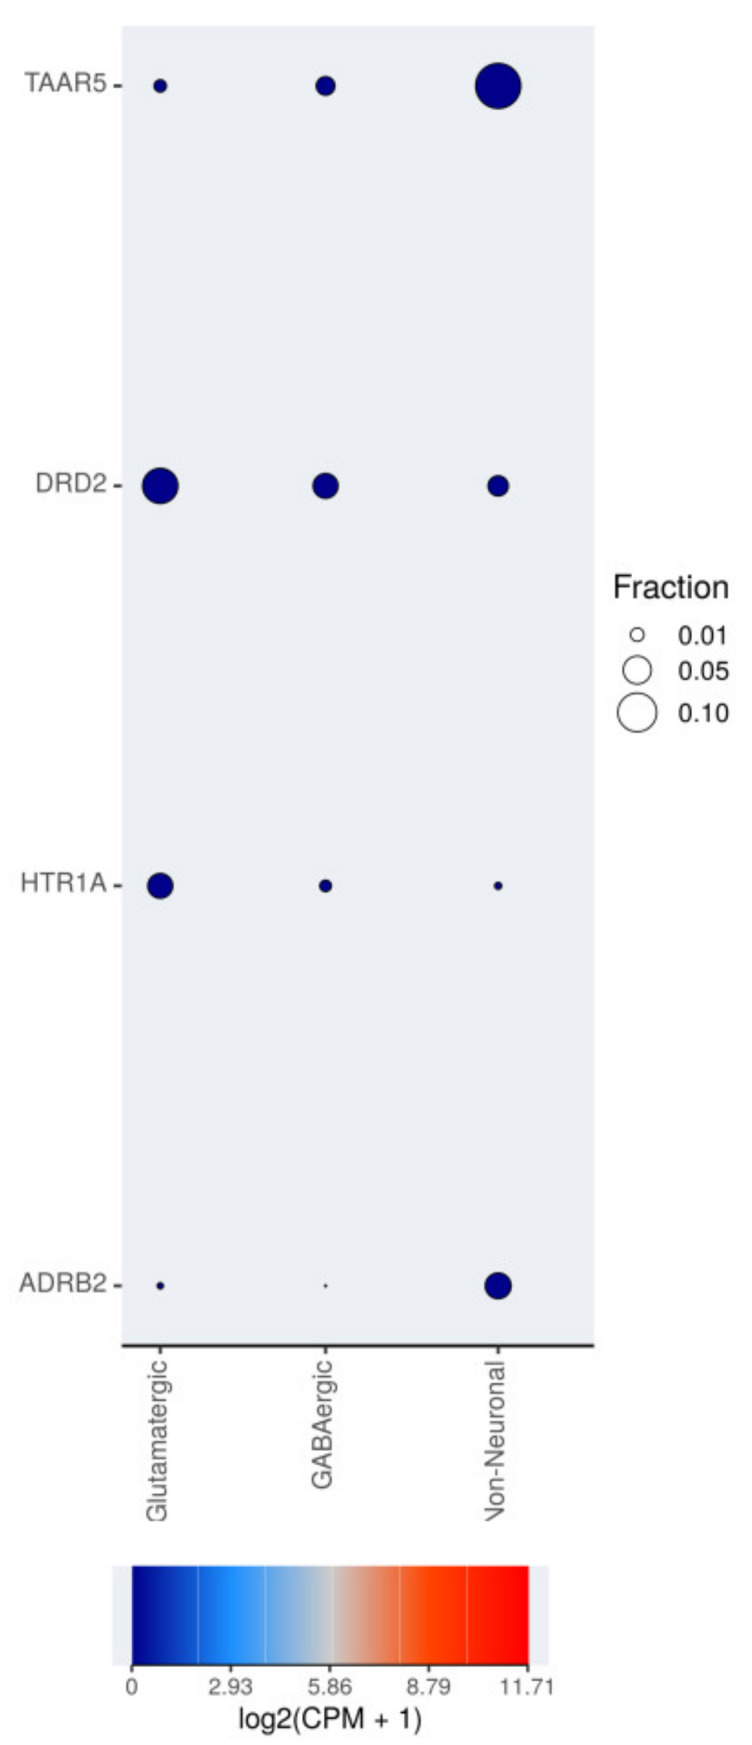
Figure 5.

Single-nuclei TAAR5, DRD2, HTR1A, and ADRB2 expression in different cell types in human middle temporal gyrus. RNA-sequencing data are available on the RNAseq Data Navigator (http://celltypes.brain-map.org/rnaseq/human (accessed on 10 March 2021, [28]); the figure was generated by the RNAseq Data Navigator interactive web interface. Fraction is the fraction of cells that are positive for mRNA expression.
