Figure 5.
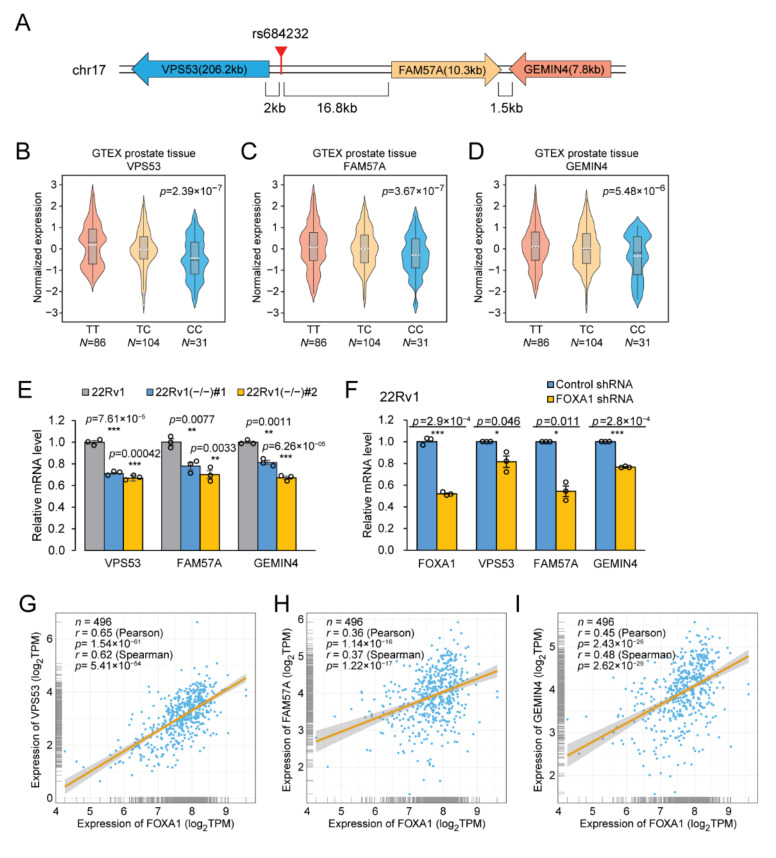
rs684232 regulates gene expression of VPS53, FAM57A, and GEMIN4 through FOXA1. (A) The location of the rs684232 relative to three target genes. (B–D) eQTL analysis in GTEx prostate tissues to reveal the association between alleles of rs684232 and VPS53 (B), FAM57A (C), and GEMIN4 (D) genes. p values are from a linear regression model. (E) Gene expression quantification of VPS53, FAM57A, and GEMIN4 by RT-qPCR in three 22Rv1 cells, including parental 22Rv1 cells and mutated cells 22Rv1(−/−) #1/ #2. Mean ± SEM of three biological replicates. ** p < 0.01, *** p < 0.001, two-tailed Student’s t-test. (F) Gene expression quantification of VPS53, FAM57A, and GEMIN4 by RT-qPCR in 22Rv1 cells treated with FOXA1 shRNA. Mean ± SD of three technical replicates. * p < 0.05, *** p < 0.001, two-tailed Student’s t-test. (G–I) Gene expression correlation analysis between transcription factor FOXA1 and the three target genes VPS53 (G), FAN57A (H), and GEMIN4 (I) in prostate tumor tissues from TCGA-PRAD database. Correlation coefficient (r) values and p values were from Pearson or Spearman correlation analysis, respectively. (J–L) Gene expression correlation analysis between FOXA1 and VPS53 (J), FAM57A (K), or GEMIN4 (L) in 33 kinds of cancer tissues from TCGA. The Pearson correlation coefficient value of each cancer type was plotted vs. the −log10 of p-value. The dot in yellow represents the PRAD. Correlation coefficient (r) values and p values were from the Pearson correlation analysis.


