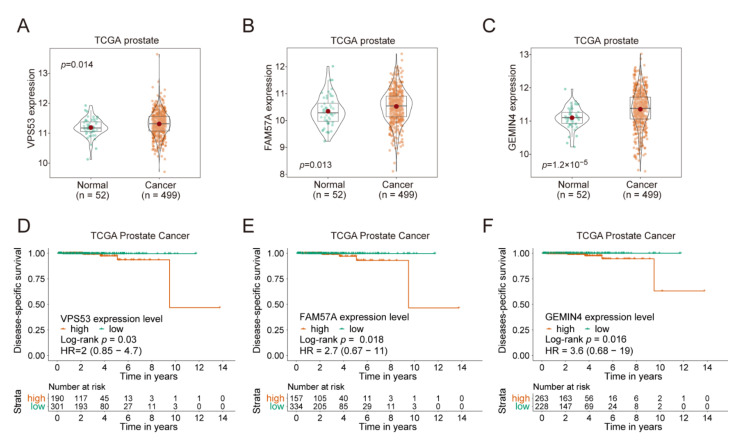
Figure 7.
VPS53, FAM57A, and GEMIN4 affect cancer progression. (A–C) Violin box plot to compare gene expression of VPS53 (A), FAM57A (B), and GEMIN4 (C) at mRNA level between normal and cancer tissues from TCGA. Gene expression value was showed as log2 value of reads data, with the mean, median, 0.25, and 0.75 quantiles represented. p values were examined by Mann-Whitney U tests. (D–F) Kaplan–Meier disease-specific survival analysis of prostate cancer patients that were stratified into two groups according to the expression level of VPS53 (strata point = 2.52) (D), FAM57A (strata point = 3.92) (E), and GEMIN4 (strata point = 3.06) (F). p values were calculated by the log-rank test, with a 95% confidence interval.

