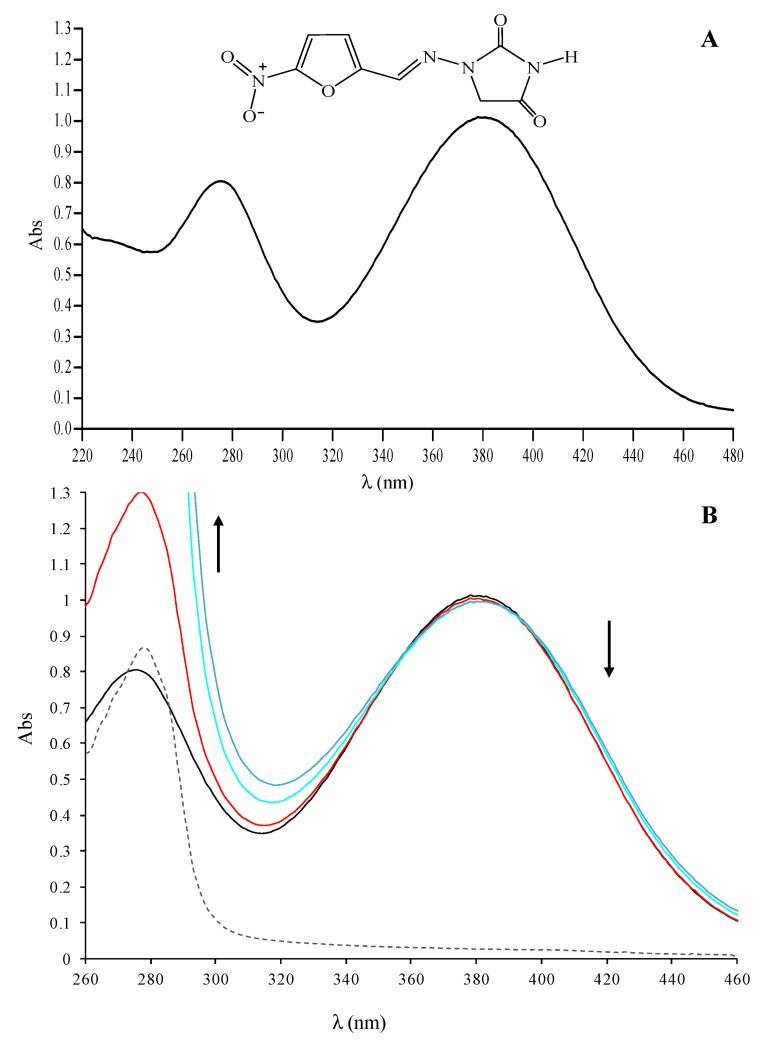
Figure 1.
Interaction of nitrofurantoin with HSA monitored by UV-VIS spectroscopy. (A) UV-VIS absorption spectrum of nitrofurantoin 60 µM; (B) UV-VIS absorption spectra of nitrofurantoin (60 µM) in the absence (dark line) or in the presence of HSA 30 (red line), 45 (cyan line), or 60 (blue line) µM. In the graph, the spectrum of HSA 30 µM alone is also reported (dashed grey line).

