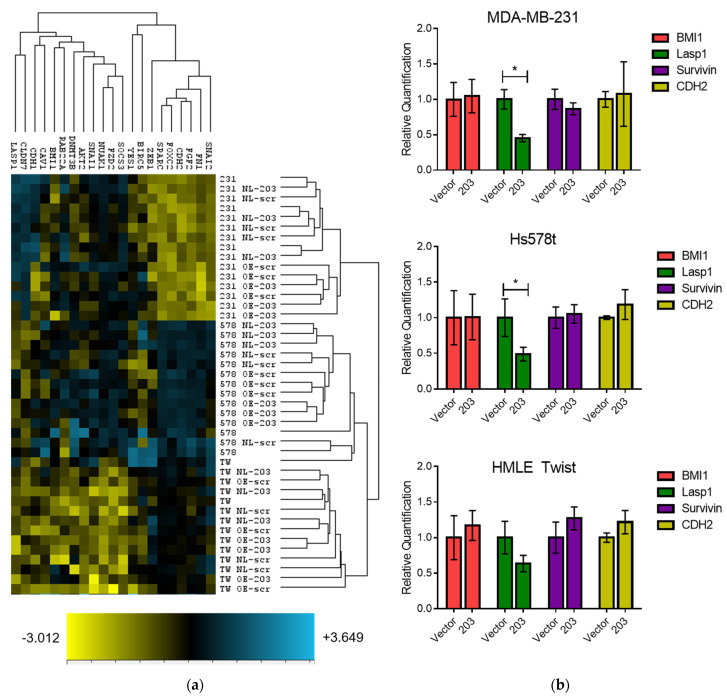
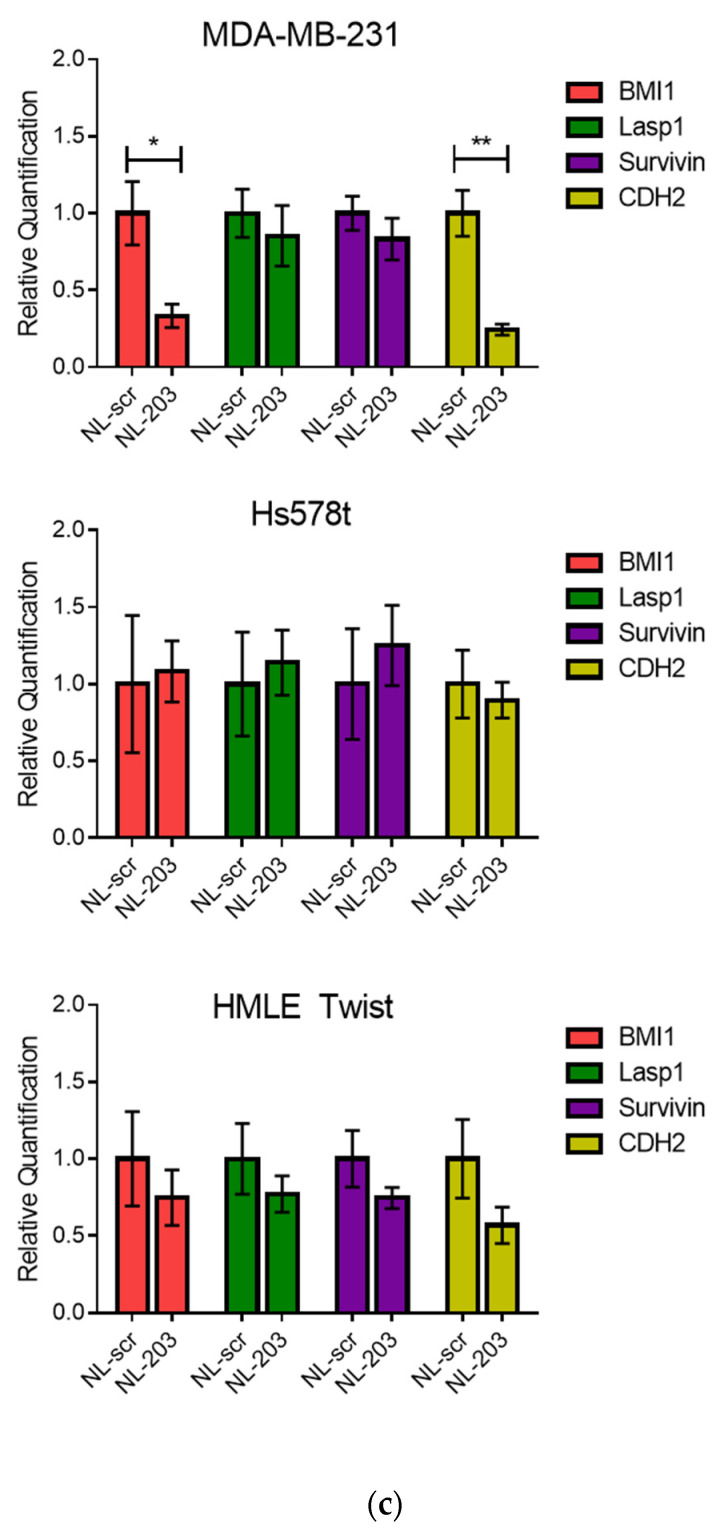
Figure 4.
mRNA expression was measured by Nanostring PlexSet analysis and qRT-PCR. (a) Counts were normalized to three control genes and represented as z-scores within a hierarchical cluster. (b,c) Expression of indicated genes for cells with constitutive (b) or nanoliposomal-mediated (c) expression of miR-203 was determined using qRT-PCR. Mean and SEM of three biological replicates measured in technical quadruplicate are shown. Expression determined relative to vector or NL-scr control and normalized to GAPDH. p-value calculated using Student’s two-tailed t-test. * p < 0.05, ** p < 0.01.


