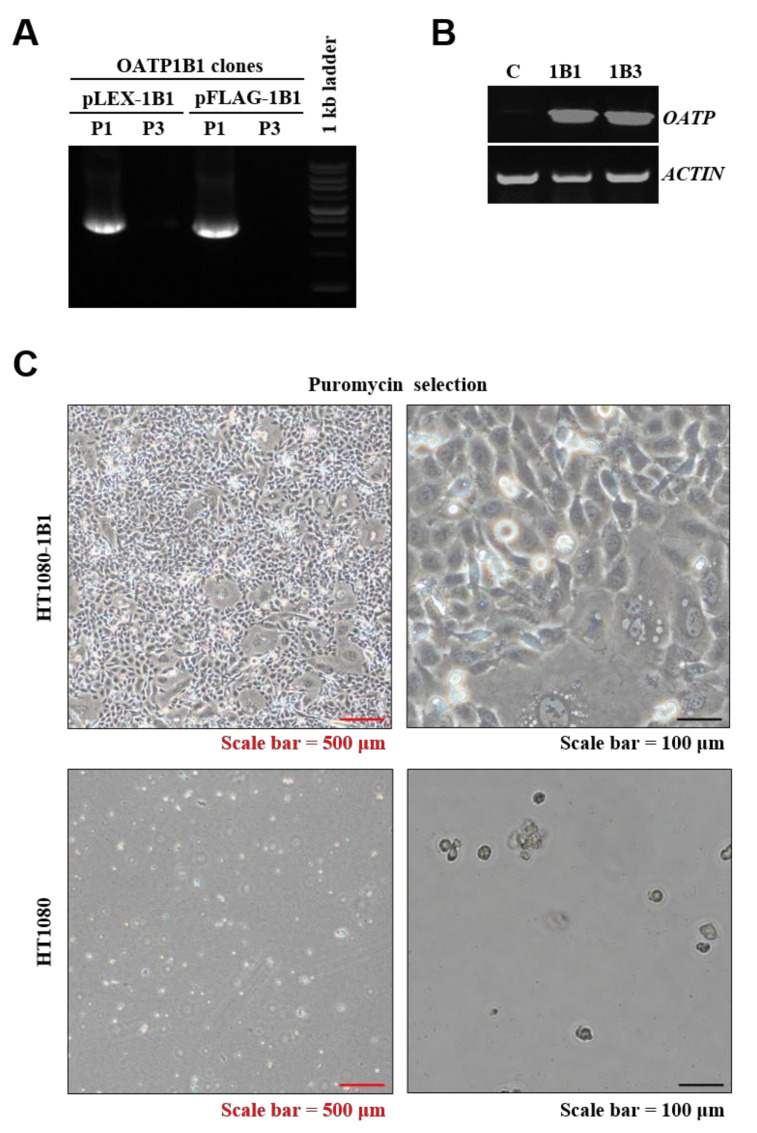
Figure 3.
Validation of OATP1B1 construction and stable-expressing cell line. (A) PCR showing insert fragments of OATP1B1 (2037 bp). (B) RT-PCR revealing the mRNA expression level of OATP1B1- and OATP1B3-expressing cells. (C) Morphology of OATP1B3-expressing HT1080 and untransduced HT1080 under 2 μg/mL puromycin selection. P1, OATP1B1-specific primer; P3, OATP1B3-specific primer; C, control; 1B1, OATP1B1-expressing cells; 1B3, OATP1B3-expressing cells.

