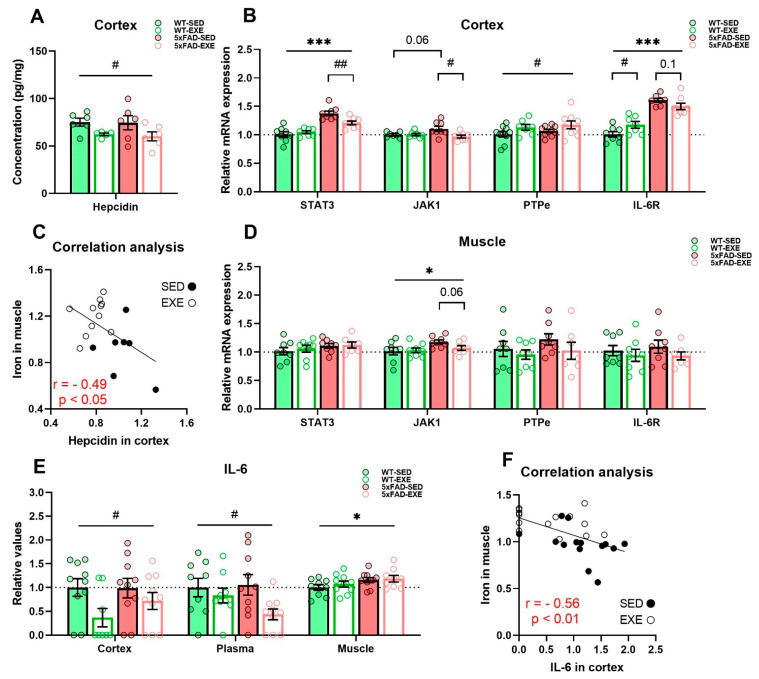
Figure 4.
Effects of regular exercise on iron homeostasis regulation in cortex and muscle tissues in 5xFAD mouse model. (A) Hepcidin level in cortex was measured by ELISA and normalized to total protein concentration. (C) Correlation analysis for total iron content in muscle and hepcidin level in cortex was performed for all mice, r–Pearson correlation coefficient. mRNA expression of STAT3, JAK1, PTPe, and IL-6R in cortex (B) and muscle (D) was measured by qPCR. (E) IL-6 level in cortex, plasma, and muscle protein samples was measured by CBA. (F) Correlation analysis for total iron content in muscle and IL-6 level in cortex was performed for all mice. All data are presented as mean ± SEM. n = 6–10/group. «*» genotype effect, «#» exercise effect: *** p < 0.001, * p < 0.05, ## p < 0.01, # p < 0.05. General genotype/exercise effect among all groups is presented as a line with «*»/«#» sign on top, exercise effect in 5xFAD or WT mice separately is presented as a bracket with «#» sign/p value on top, genotype effect in SED mice only is presented as a bracket with p value on top.

