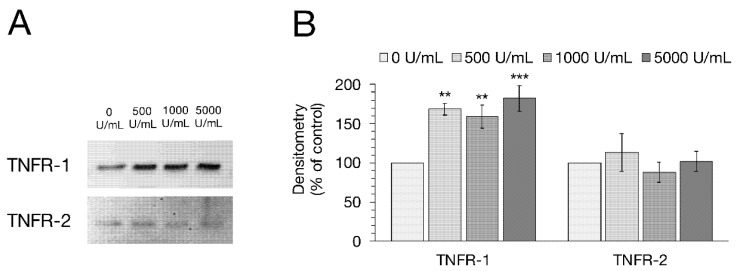
Figure 4.
(A) Representative Western blot bands and (B) Densitometry of TNFR-1 and TNFR-2 after 48 h incubation with rising TNFα concentrations (500, 1000, 5000 U/mL). After specific protein bands were normalized on total protein amount, the protein expression of untreated cells was normalized to 100% and groups treated with TNFα were compared to this, respectively. Incubation with the cytokine led to a clear increase in TNFR-1 expression, while TNFR-2 remained unchanged. Data are shown in mean ± SEM (one-way ANOVA, ** p < 0.01, *** p < 0.001; n = 4).

