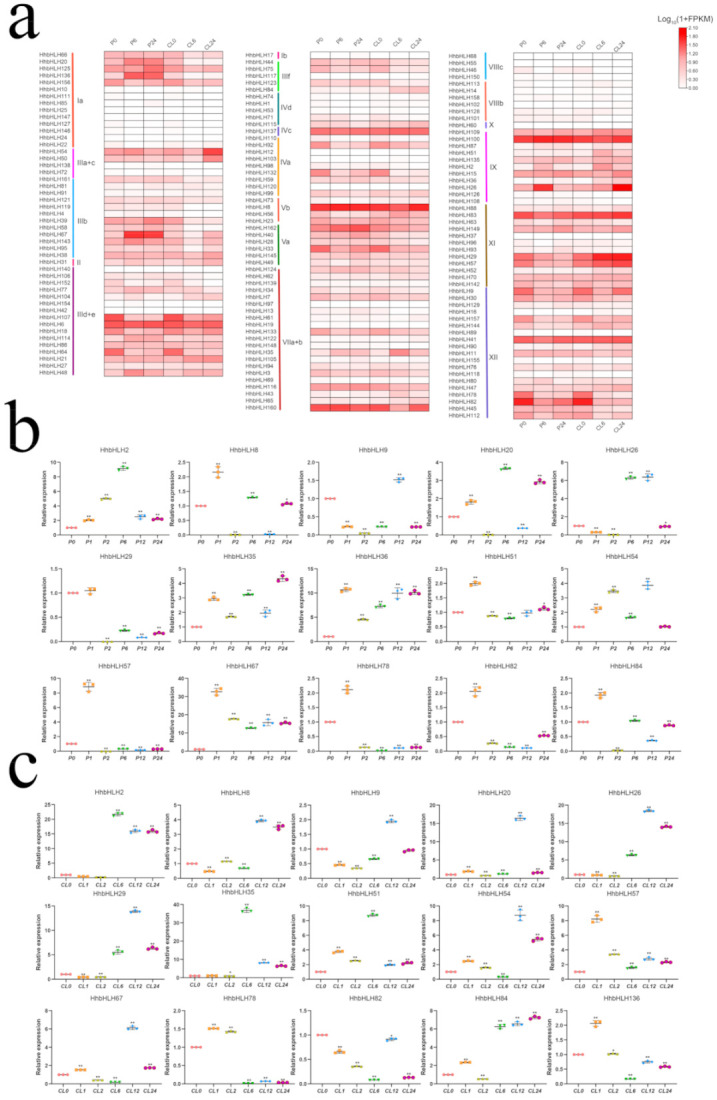
Figure 7.

Expression profile of HhbHLHs under drought and salt stresses. (a) A heatmap shows the expression level of 162 HhbHLH genes with different subfamilies in salt and drought stress of H. hamabo. Expression differences are observed in different colors. The P0, P6, P24 represent 0 h, 6 h, and 24 h were treated with PEG; CL0, CL6, and CL24 represent 0 h, 6 h, and 24 h were treated with NaCl. A color change indicates a change in expression level; white indicates a lower level of expression, whereas red indicates a higher level of expression. (b) Relative expression of 15 HhbHLH genes chose at random with PEG treatment, P0, P1, P6, P12, and P24 represent 0 h, 1 h, 2 h, 6 h, 12 h, and 24 h were treated with PEG. (c) Relative expression of 15 HhbHLH genes chosen at random with NaCl treatment, CL0, CL1, CL6, CL12, and CL24 represent 0 h, 1 h, 2 h, 6 h, 12 h and 24 h were treated with NaCl. The ACT gene was used to normalize the data, and vertical bars represent standard deviation. Asterisks denote genes that are significantly up-or down-regulated in comparison to the untreated control (* p < 0.05, ** p < 0.01, Student’s t-test).
