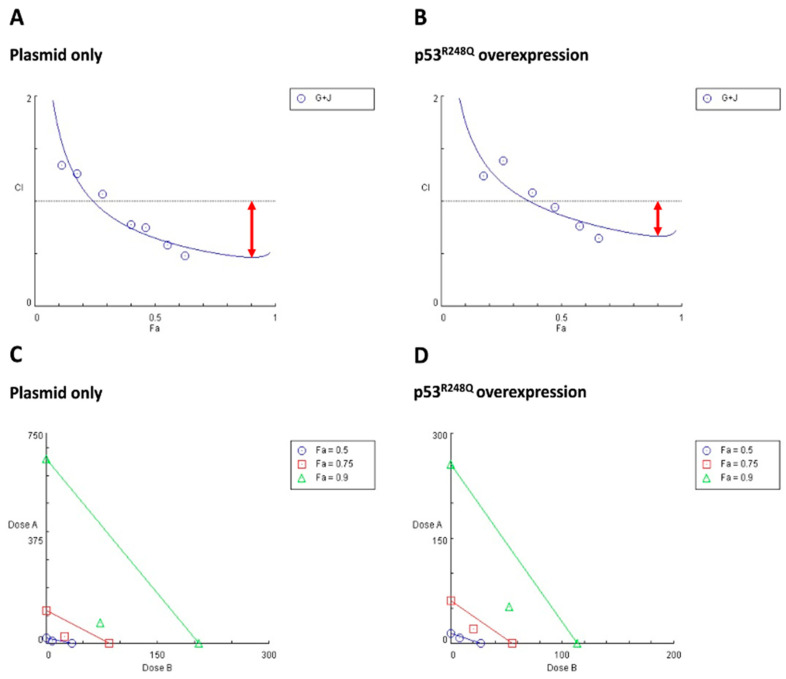
Figure 5.
Synergistic effects of gefitinib and JNJ on OVCAR3 cells with different p53 statuses were shown in Fa-CI plots and isobolograms. Based on the Chou and Talalay methods, the combination index (CI) values were calculated using CompuSyn software to determine the degree of synergistic effectiveness of the drug combination. The analysis revealed that overexpression of p53R248Q reduced the synergistic effect of gefitinib and JNJ. (A,B) In the Fa-CI plots, the fraction affected (Fa; from zero to one) represented the ratio of dead cells-to-total cells in response to drug treatments. Circled symbols indicated the CI values of each Fa. The CI values provided a quantitative definition of synergistic (CI < 1), additive (CI = 1), and antagonistic (CI > 1) effects derived from the drug combination. (G + J: gefitinib + JNJ) (C,D) In the isobolograms, the individual doses of JNJ (represented by x-axis) and gefitinib (represented by y-axis) that achieved 90% (Fa = 0.9), 75% (Fa = 0.75), and 50% (Fa = 0.5) inhibitory effects were indicated by green lines, red lines, and blue lines, respectively. Symbols (ED90 was marked as green triangles; ED75 was marked as red squares; ED50 was marked as blue circles) above the lines, on the lines, and below the lines represented antagonistic, additive, and synergistic effects, respectively. When the symbols were located below and distant from the lines, it represented strong synergism.

