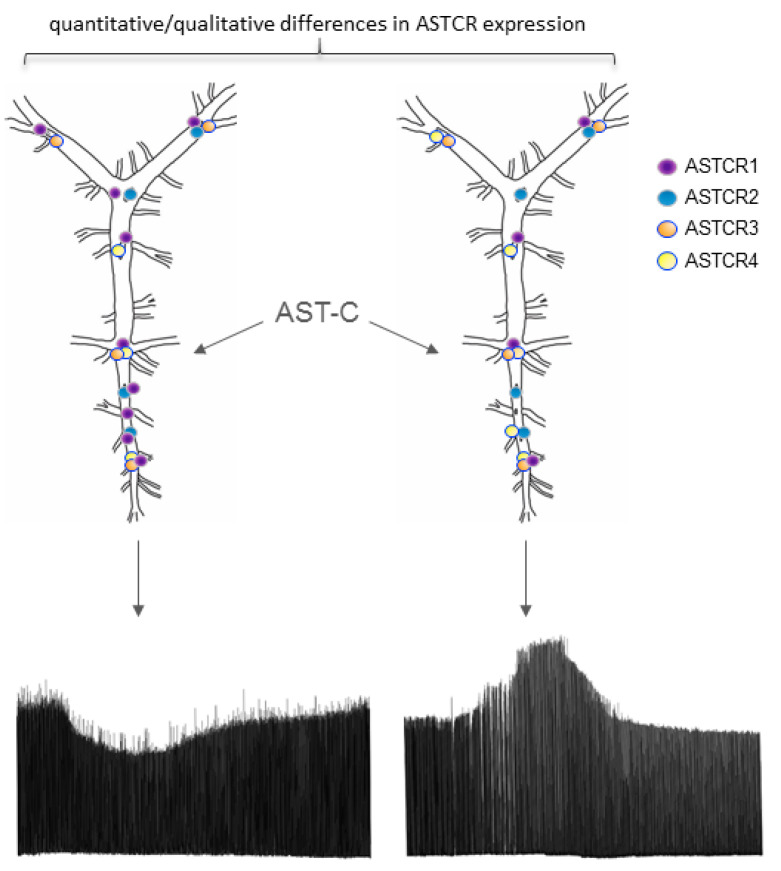
Figure 9.
Differential receptor distribution partially explains individual variation in response to AST-C. This schematic shows two different cardiac ganglia (CG) with differential receptor expression; importantly, the CG on the left has a higher expression of ASTCR1 than the CG on the right. As explained by the correlation with physiological response, the CG with higher ASTCR1 expression responds to AST-C with a decrease in contraction amplitude, while the CG with lower ASTCR1 expression responds to AST-C with an increase in contraction amplitude. Notably, there is also a nonsignificant correlation with the ratio of ASTCR1:ASTCR4 expression and physiological response, while ASTCR2 and ASTCR3 expressions remain constant. ASTCR3 and ASTCR4 are depicted with blue lines to indicate potential intracellular, non-ligand binding functionalities.

