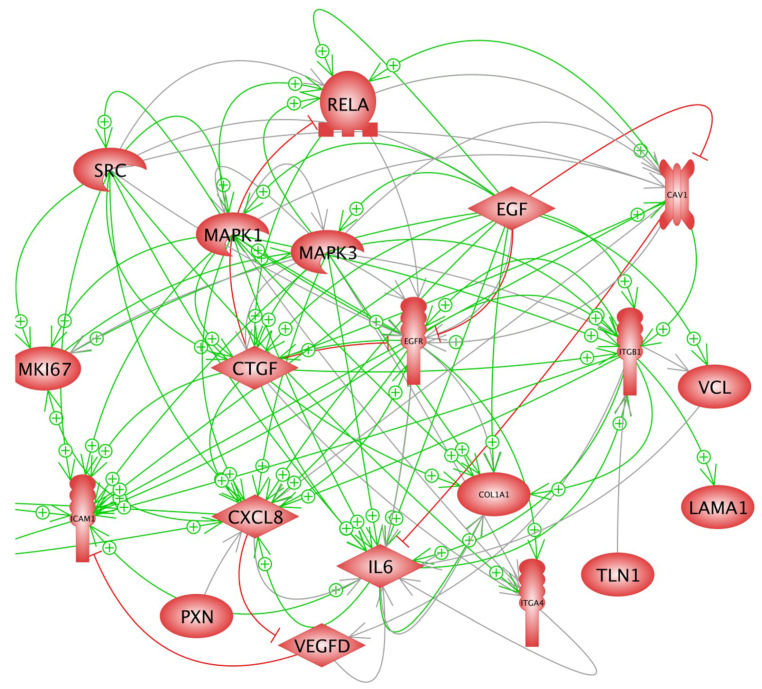
Figure 7.
Interaction of the genes analysed by quantitative real-time polymerase chain reaction. Green arrows indicate stimulation and red lines with a terminal crossbar show inhibition. Grey arrows indicate an interaction with an unknown effect. Of note, most of the green arrows start near the SRC and EGF icons.

