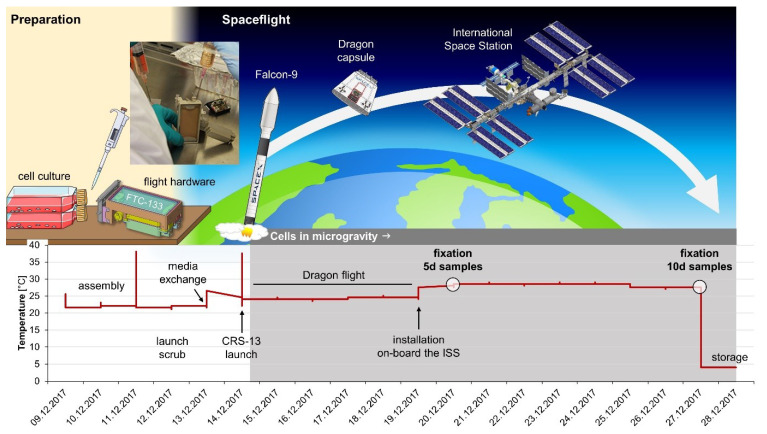
Figure 8.
Time course and temperature profile of the Cellbox-2 spaceflight experiment on the International Space Station. An equivalent time course and temperature profile were also applied for the 1g ground control experiment. Parts of the figure were drawn by using pictures from Servier Medical Art, and they are licensed under a Creative Commons Attribution 3.0 Unported License (https://creativecommons.org/licenses/by/3.0/ (accessed on 20 July 2021)).

