Figure 1.
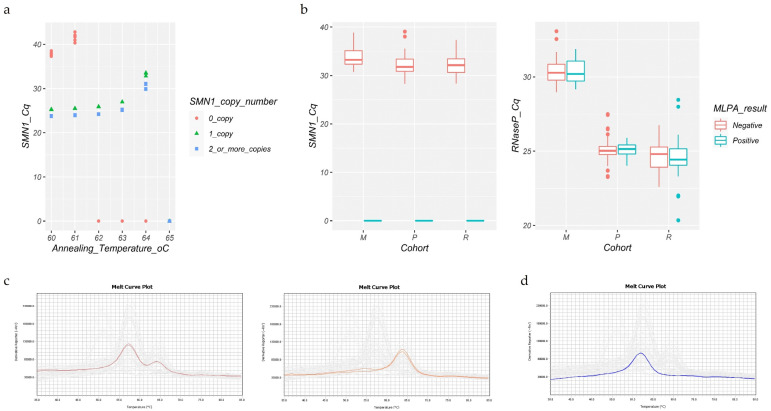
(a) Temperature gradient. The specificity for SMN1 over SMN2 is observed at 62 °C, 63 °C, and 64 °C. The highest specificity was chosen for the assay. The SMN1 copy number refers to the MLPA genotypes. (b) Box plots of the Cq values obtained in the real-time PCR test. The box colors indicate the result obtained through MLPA. The data include inconclusive samples. Significant differences were observed for the medians of the SMN1 Cq values between the mixed compared to the retrospective and prospective cohorts (p-values < 0.0005). The RNase P Cq medians were different among all the comparisons (p-values < 0.0005). M, mixed cohort; P, prospective cohort; R, retrospective cohort. (c,d) The melt curve assay. Representative plot of two negative samples showing SMN1 peaks in both images and a SMN2 peak in the right one (c); representative plot of a positive sample result showing just the SMN2 peak (d).

