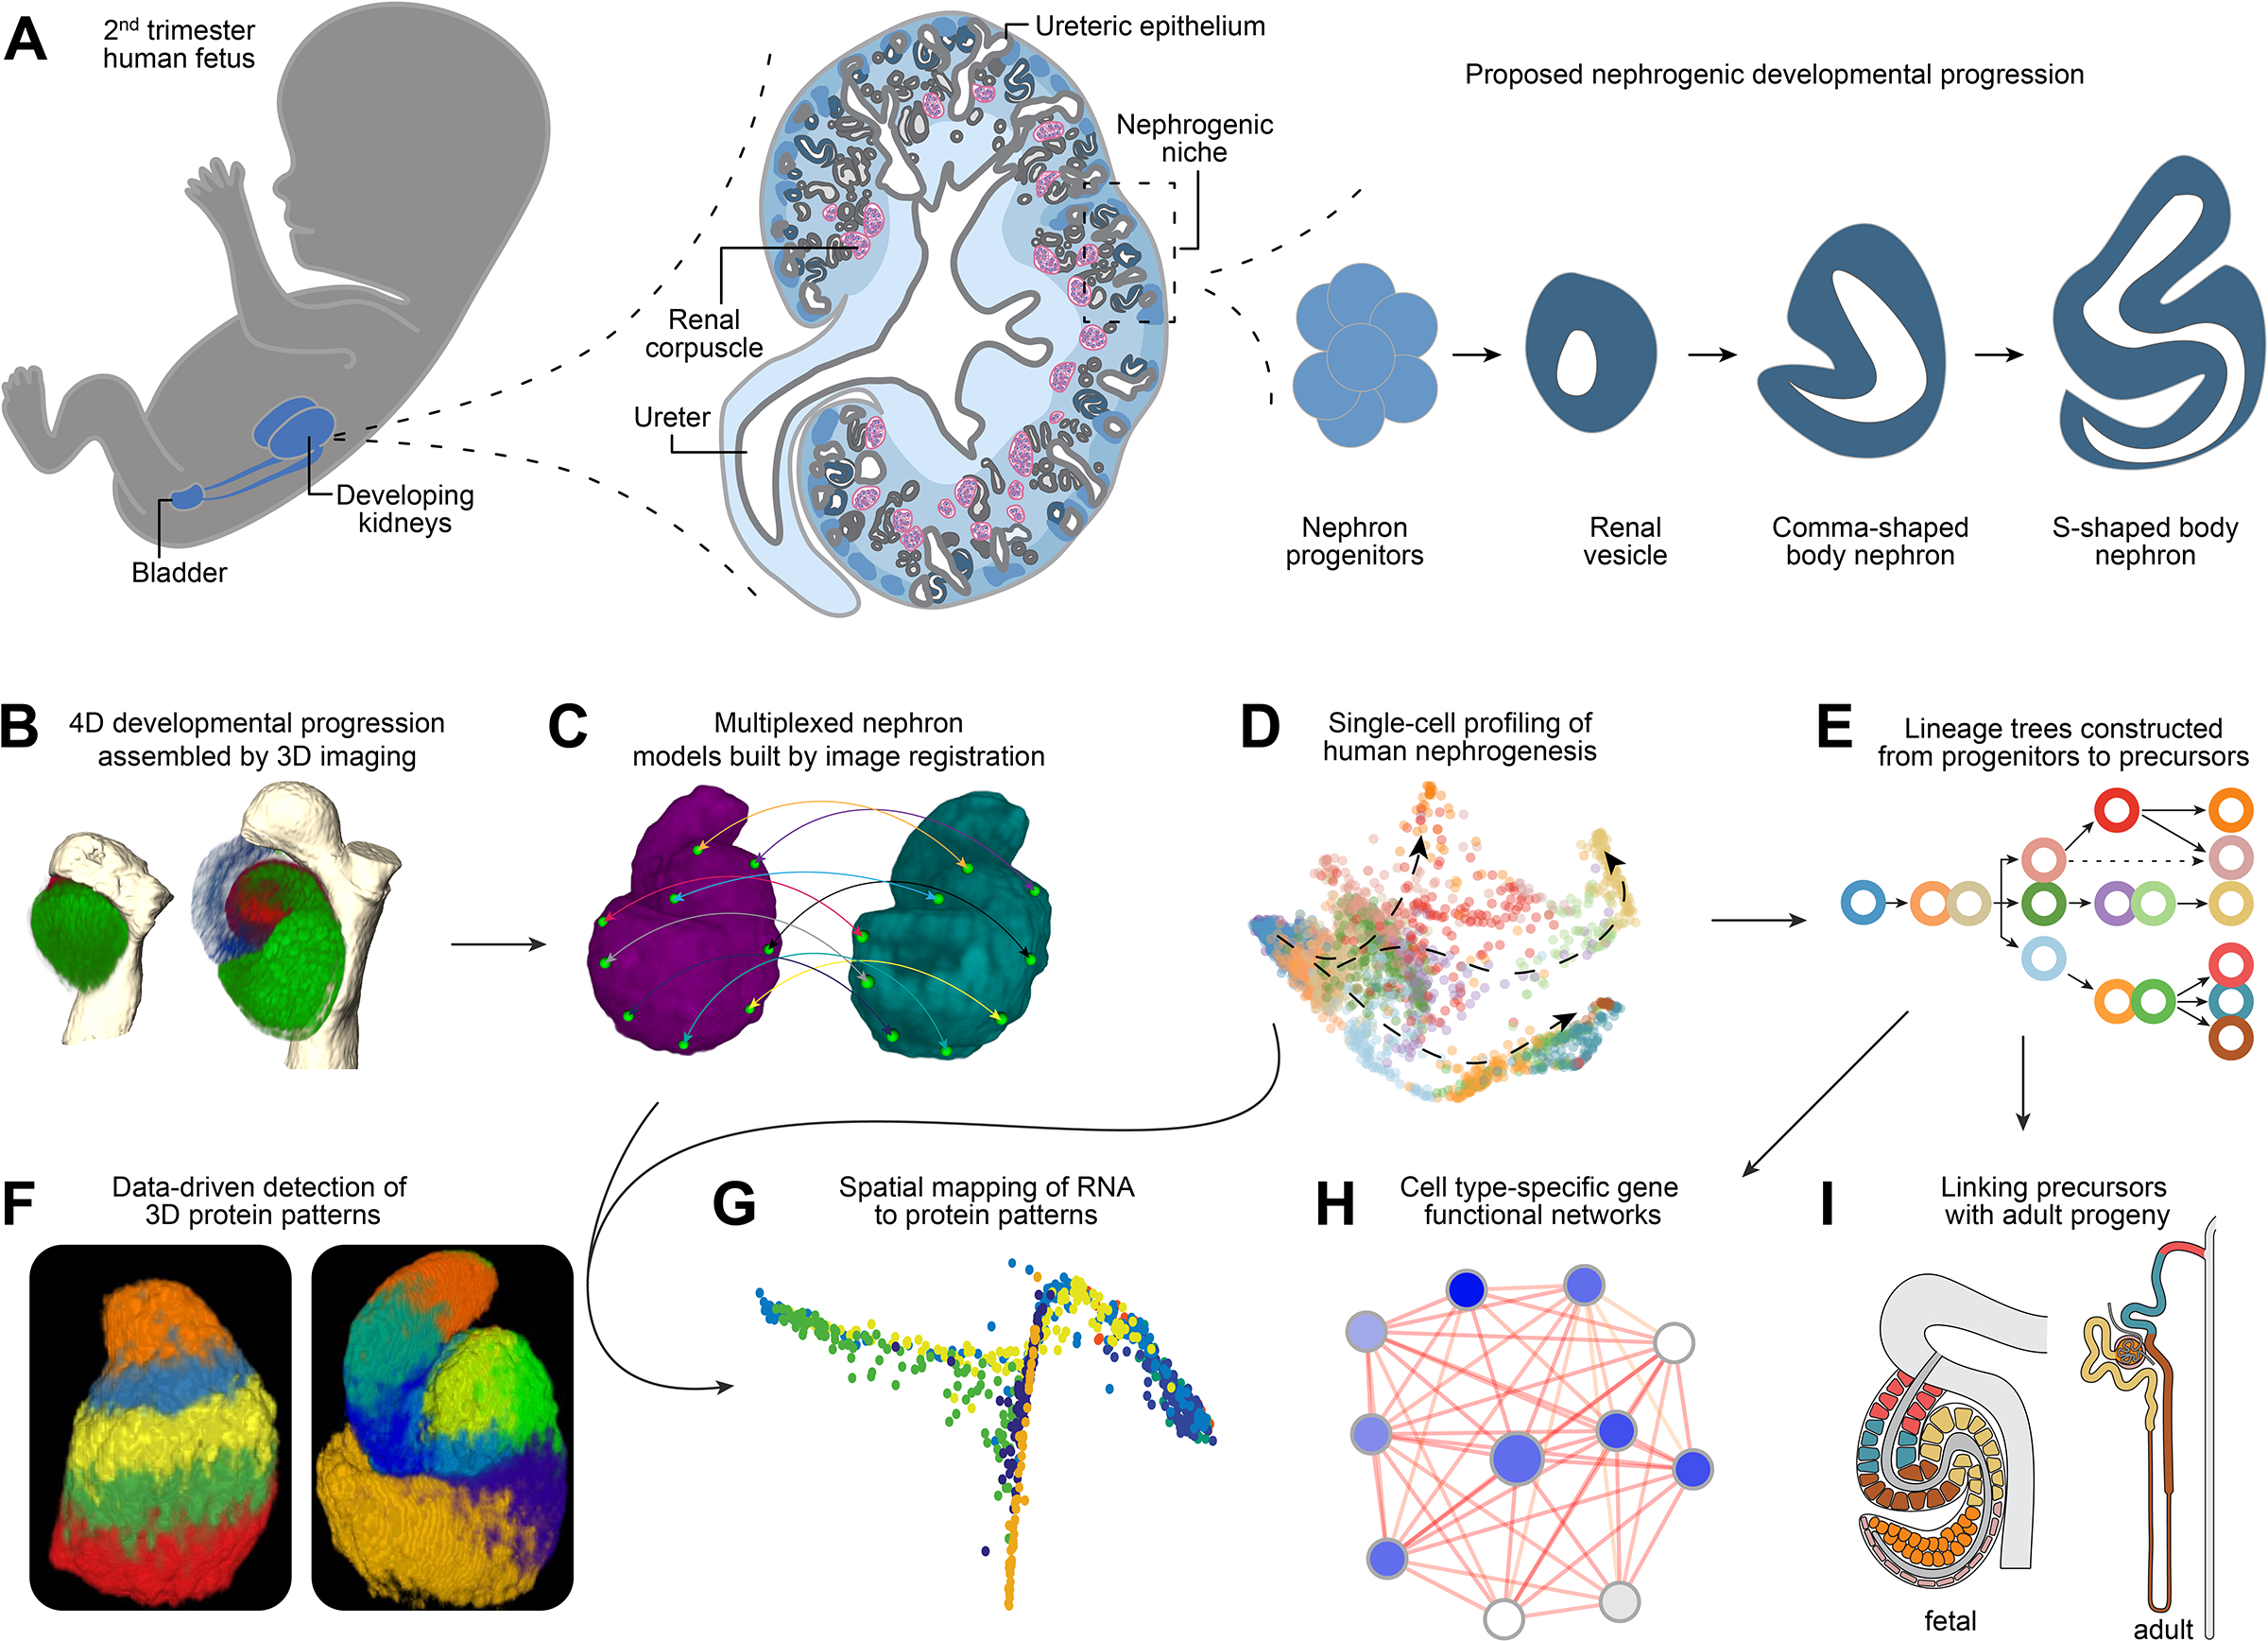
Figure 1 – Assembly of the Human Nephrogenesis Atlas.

Schematics and data illustrating: (A) Basic principles of human nephrogenesis. Schematic depicts genitourinary system in human fetus (left), a cross section of a developing human kidney (middle), and the proposed nephrogenic program (right). Dashed lines indicate magnified portions shown in a left to right direction. Shades of blue from lightest to darkest in kidney cross section indicate inner medulla, outer medulla, cortex, nephron progenitors, developing nephrons. Ureteric epithelium is shown in grey and maturing nephrons beyond the S-shaped body stage in dark grey. Renal corpuscles as indicated (pink/blue). (B) Visualization of immunofluorescently labelled nephrons in 3D. (C) Image registration of nephron protein data into multiplexed models. (D) Single cell RNA profiling of human nephrogenesis. (E) Establishing a lineage tree for nephrogenesis. (F) Computational approaches to predict protein patterns in 3D space. (G) Spatial mapping of RNA to protein models. (H) Building cell-type specific functional gene networks. (I) Linking precursors with their mature progeny.
