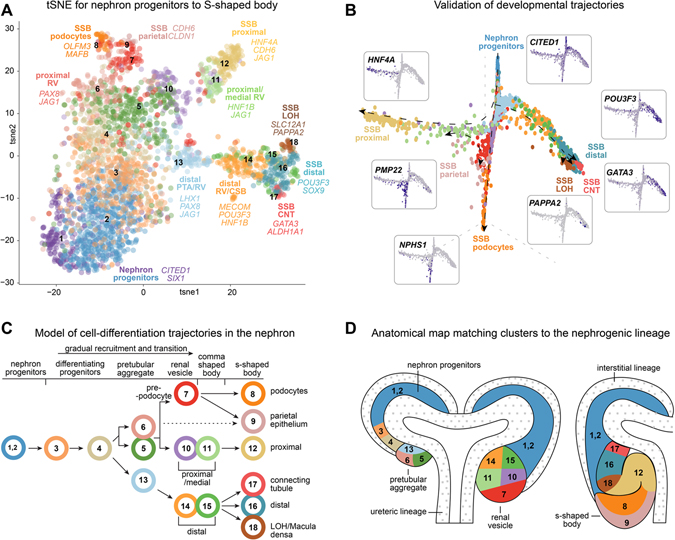
Figure 3 -. Single cell analyses and spatial mapping resolve precursor transcriptomes.
(A) tSNE plot of 18 cell clusters of cells from human nephrogenic lineage with cell-types and marker genes indicated. (B) Graph-based dimensionality reduction plots of all cell transcriptomes (clusters 1–18) color coded according to cell clustering in Figure 3A. Marker genes for each endpoint shown as inserts. (C, D) Lineage tree model for nephrogenesis placing cell transcriptomes in clusters 1–18 into a tree formation and into an anatomical schematic for the nephrogenic niche. Colors and numbers correspond to cluster colors in Figure 3A. Arrows indicate direction of differentiation. Dotted arrow indicates uncertain relationship. Stages and precursor regions or identities as annotated. White areas with small grey dots in D mark the ureteric epithelium and the interstitium which did not form part of these analyses.

