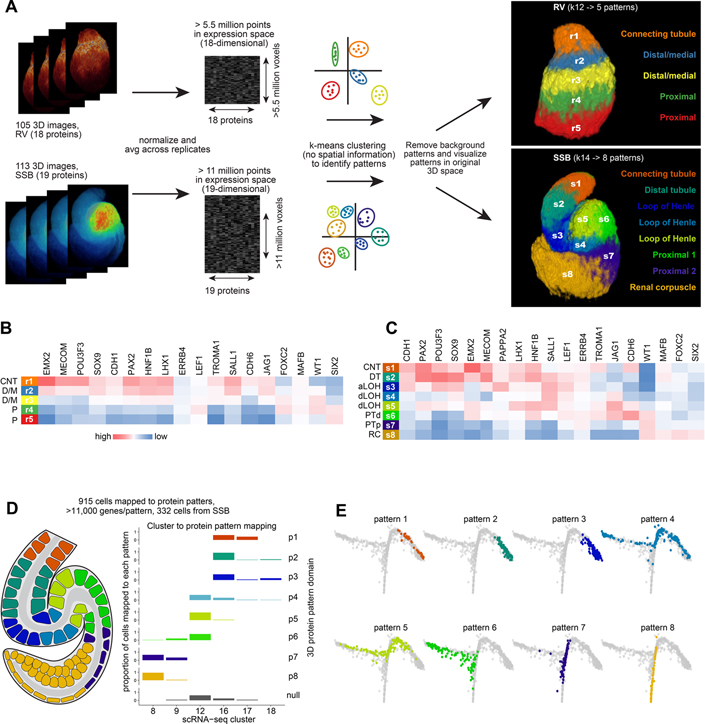
Figure 4 -. Unsupervised clustering approaches predict precursor populations.
(A) Workflow of computational approach used to apply k-means clustering to 3D multi-dimensional voxel-based data and resulting predictions of combinatorial protein patterns. (B, C) Protein abundance across predicted protein patterns in renal vesicles and S-shaped body nephrons. (D) Schematic of mapping of cells to 8 protein patterns in the S-shaped body nephron and proportion of cells of the selected clusters mapping to each protein pattern. (E) Graph-based dimensionality reduction plots of all cell transcriptomes (clusters 1–18) showing cells spatially mapped to S-shaped body patterns. Colors in E correspond to protein patterns as shown in D. CNT: connecting tubule. D/M: distal/medial. P: Proximal. DT: distal tubule. aLOH: analage of loop of Henle. dLOH: putative analage of descending loop of Henle. PTd: analage of proximal tubule. PTp: analage of proximal tubule and parietal epithelium. RC: renal corpuscle.

