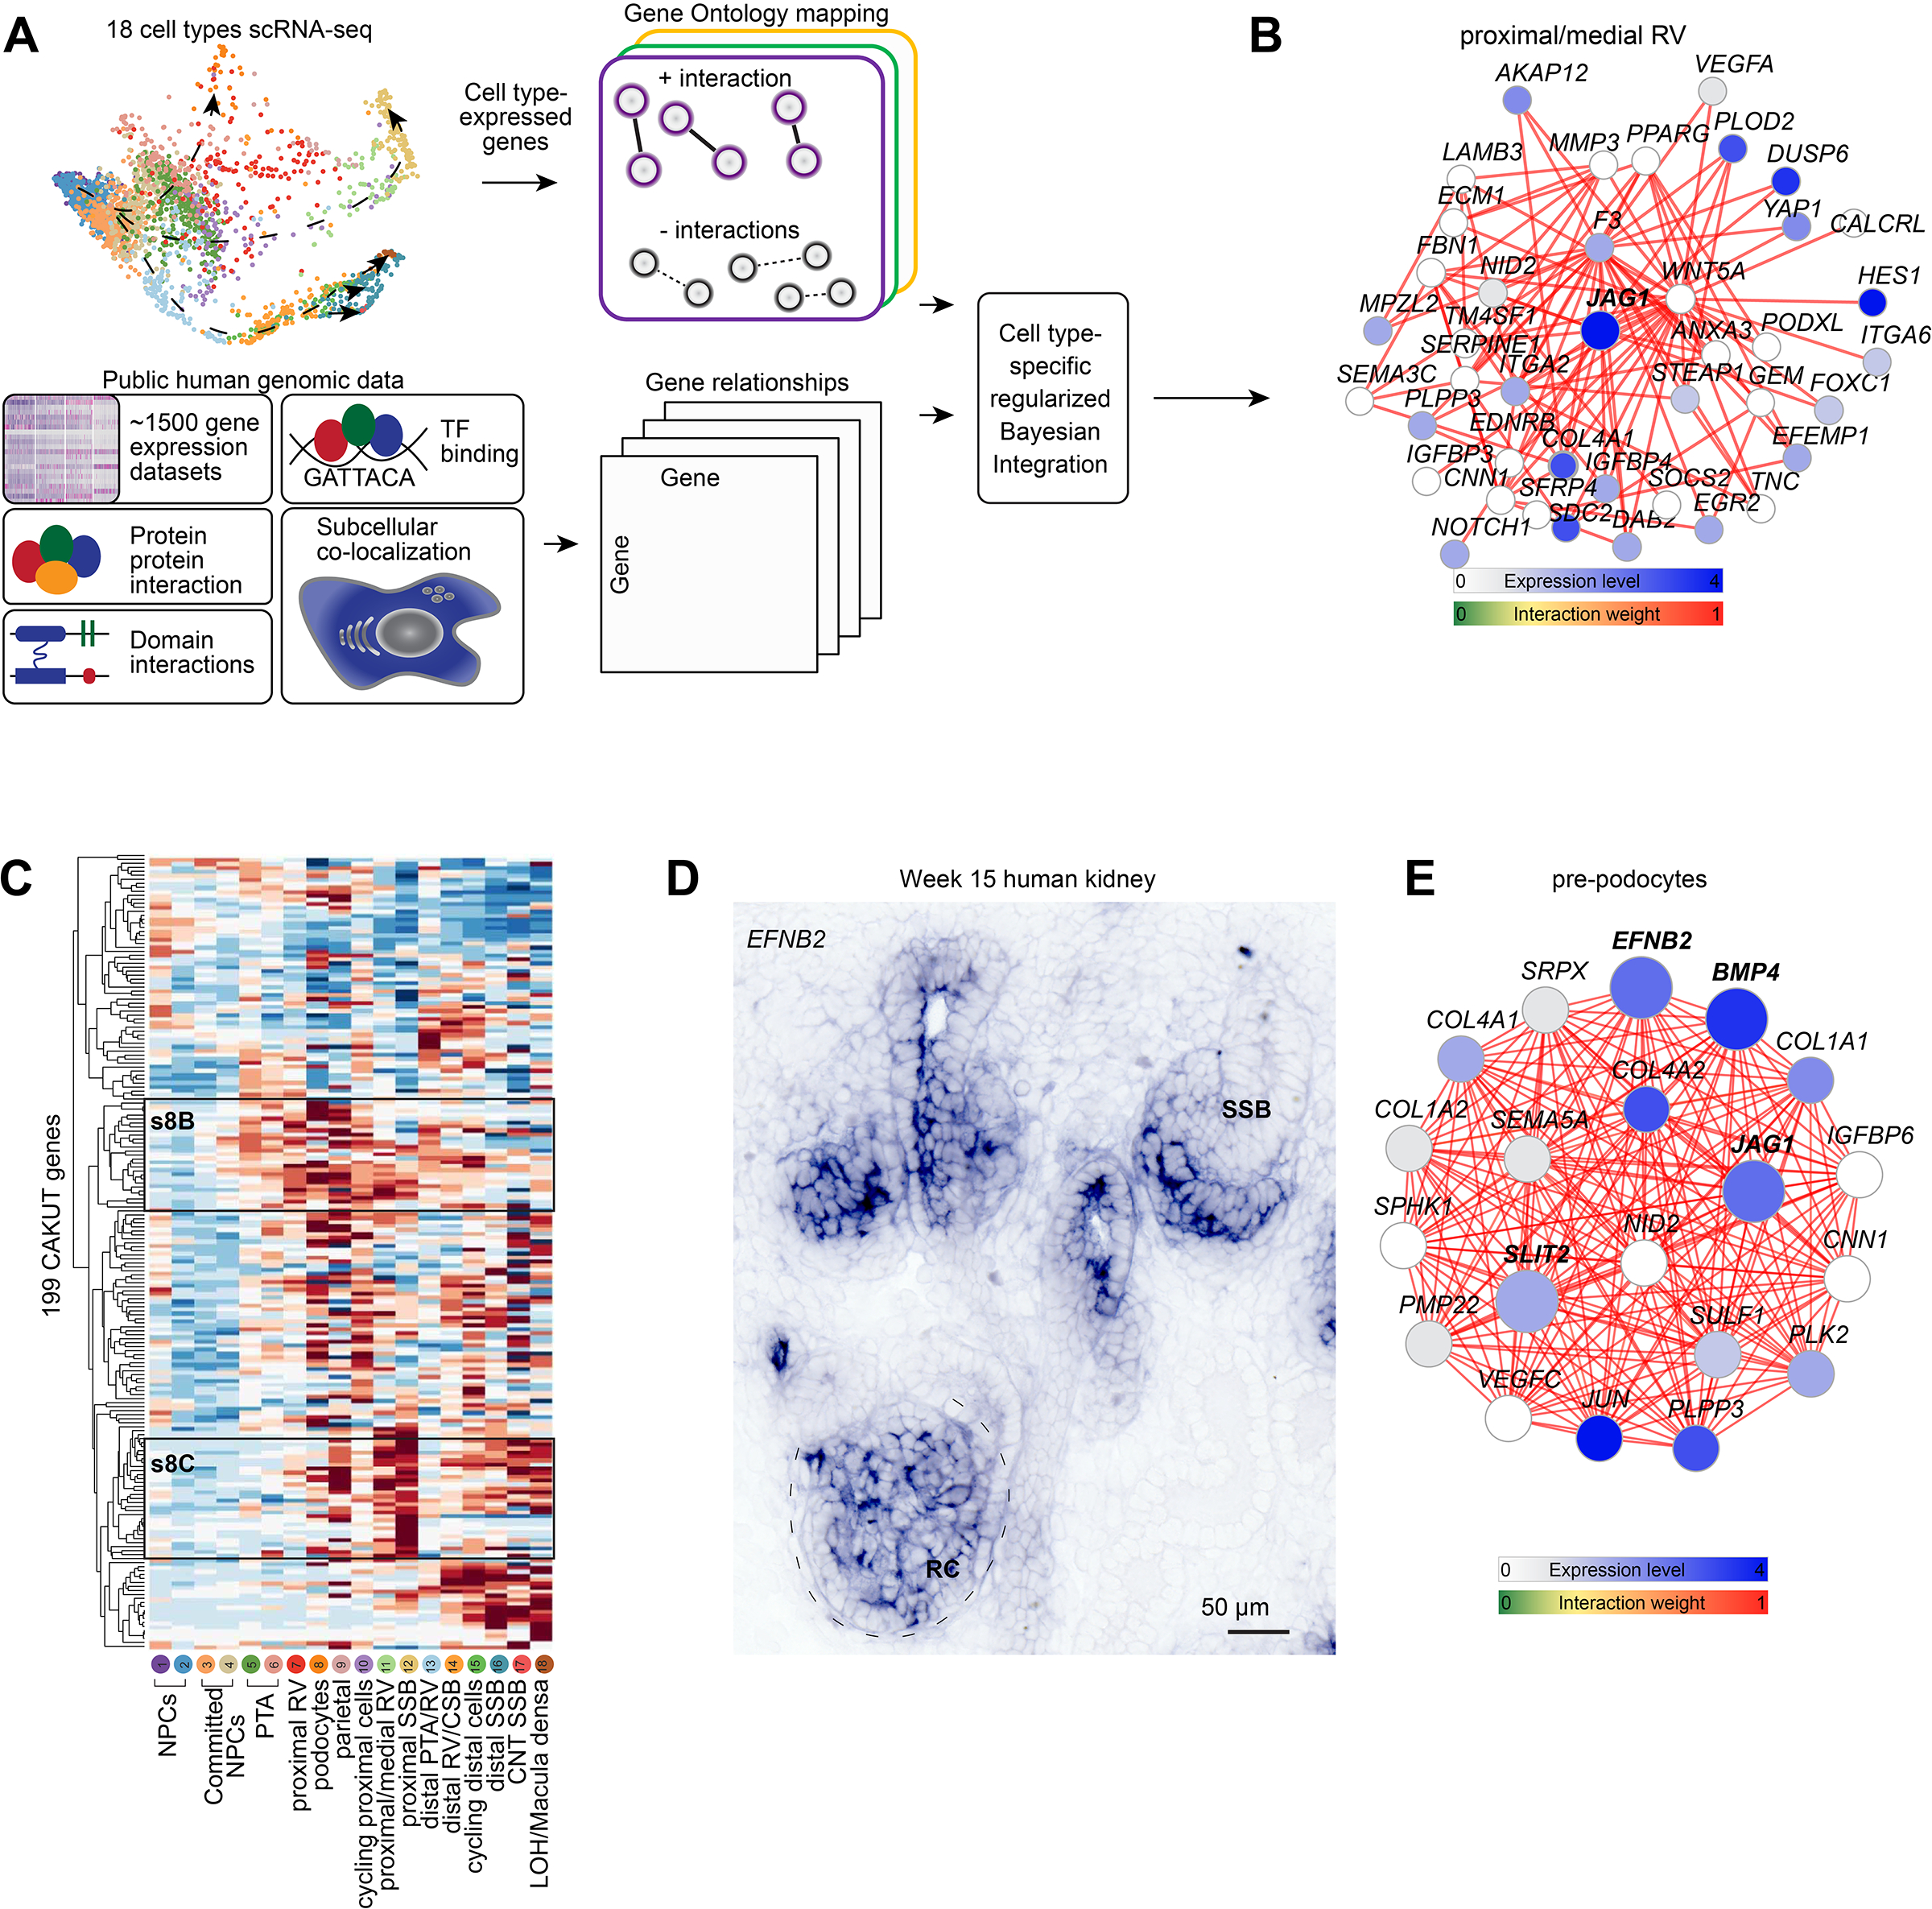
Figure 5 -. Cell-type specific functional gene networks in development and disease.

(A) Schematic for building cell-type specific functional gene networks. (B) Functional gene network for JAG1 (in bold) in the proximal/medial renal vesicle (cluster 11). (C) Hierarchical clustering of 199 CAKUT genes across cell cluster identities 1–18. High/Low as indicated. S8B and s8C annotations indicate regions highlighted in Supplementary figure 8B, C. (D) In situ hybridization for EFNB2 on human fetal kidney. (E) Example of quadruple gene network for EFNB2, JAG1, SLIT2, and BMP4 – in bold. Scales and stains as indicated. Expression levels and edge weights as indicated by scales on panels. PTA: pretubular aggregate. RV: renal vesicle. CSB: comma-shaped body nephron. SSB: S-shaped body nephron. CNT: connecting tubule. LOH/MD: loop of Henle/Macula densa precursor. RC: renal corpuscle. Gene network thresholds set for visualization purposes to ensure network simplicity.
