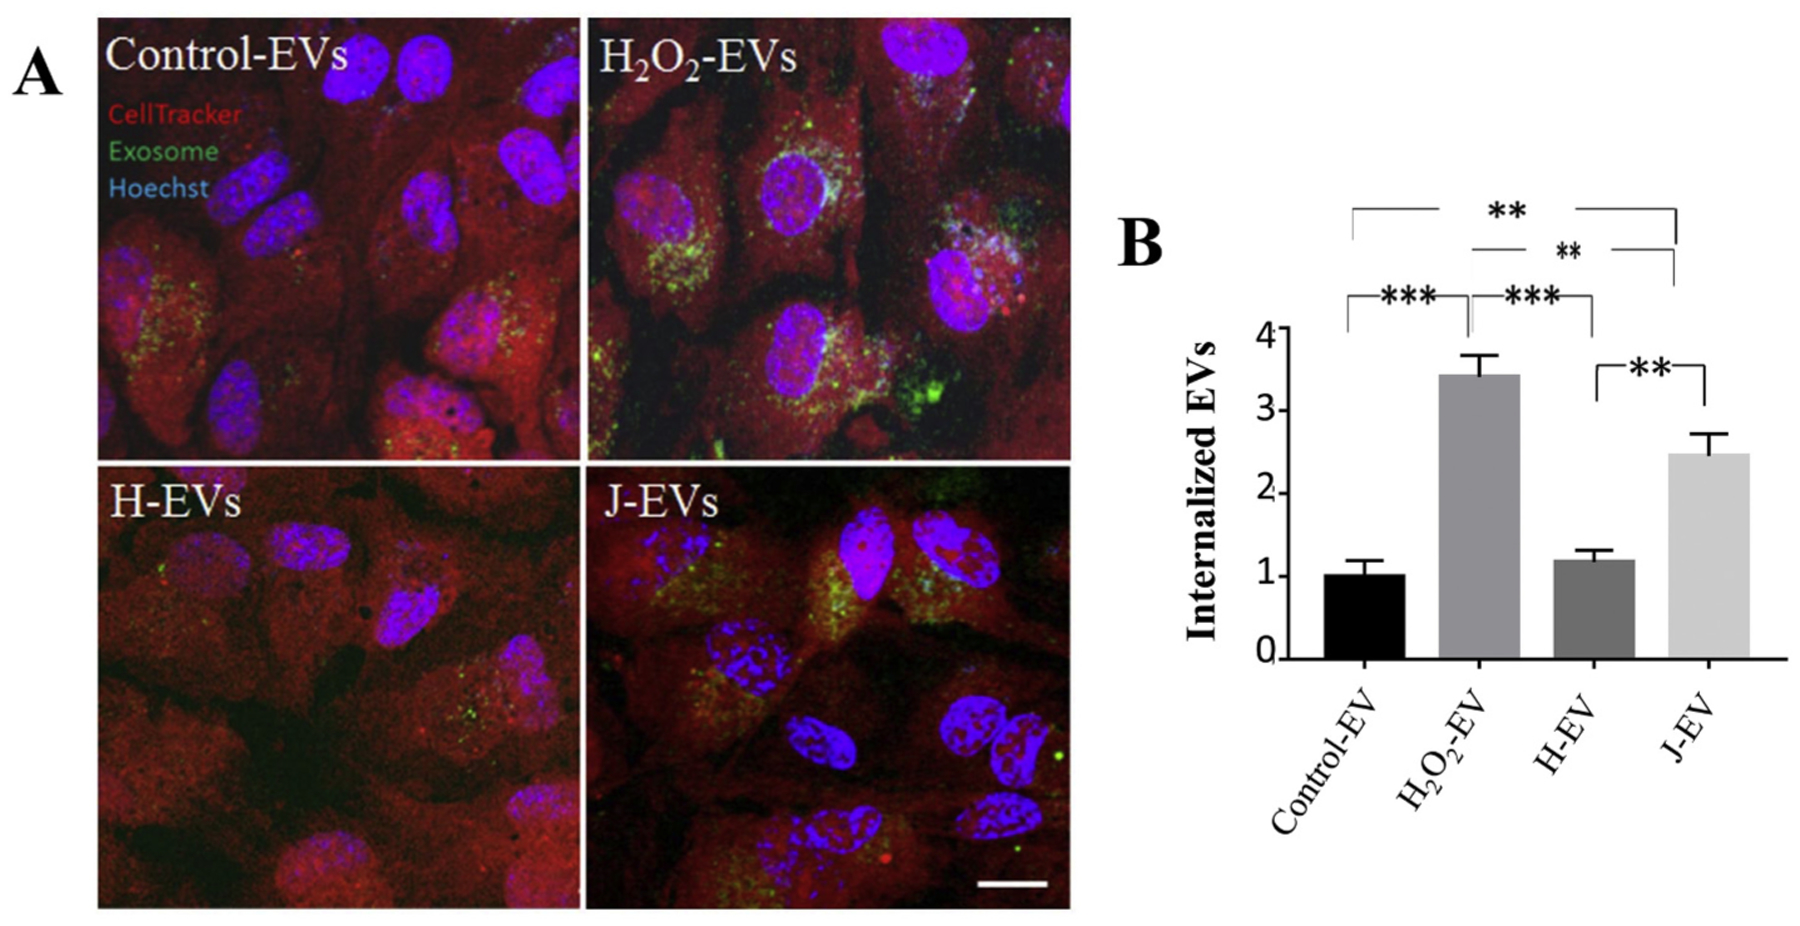
Fig. 3. Live cell imaging investigating ligand-dependent internalization of EVs.

(A) Images of live ARPE-19 cell monolayers exposed to EVs. EVs were labeled with ExoGlow (green), the cytoplasms of recipient cells were labeled with cell tracker (red) and nuclei with Hoechst (blue). Internalization of EVs was imaged by confocal; microscopy 120 min after the addition of EVs. Intracellular EVs were identified as co-localized dots between the red and green channel (= yellow). The yellow channel was binarized (representative examples in insets) and quantified in Image J. (B) Rapid uptake of J EVs in naïve ARPE-19 cells was confirmed but not H EVs. Graphs represent mean ± stdev (n = 4–8 wells, 6 locations each). Significance was obtained using a Student’s t-test, ** P < 0.001, *** P < 0.0001.
