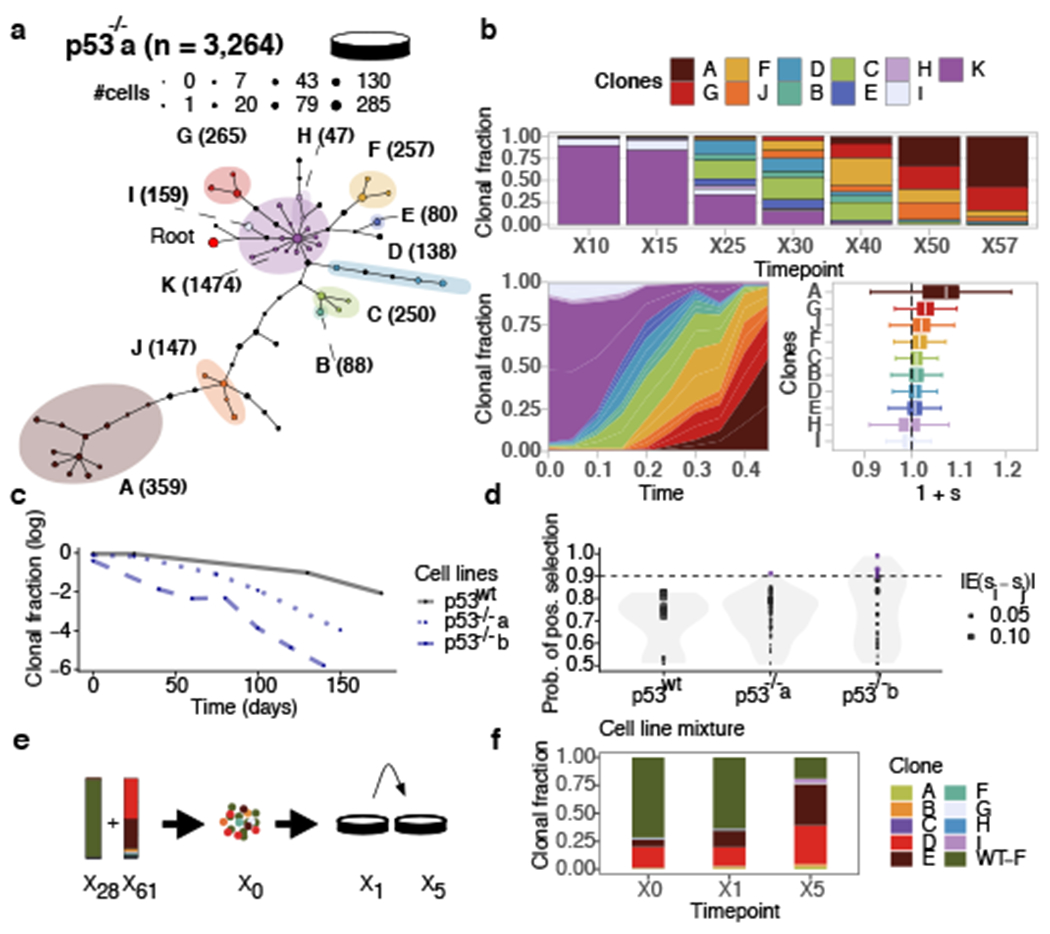
Figure 1.

Replicate branch of p53 mutant cells and engineered mixture experiment. a) Phylogeny of 3,264 p53−/−a cells, grouped in 11 phylogenetic clades over the timeseries where nodes are groups of cells (scaled in size by number) with shared copy number genotype and edges represent distinct genomic breakpoints. Shaded areas represent clones. Tree root is denoted by the red circle. b) Observed clonal fractions over time, inferred trajectories and quantiles of the posterior distributions over selection coefficients of fitClone model fits to p53−/−a with respect to the reference Clone K. In the box plots, the white line represents the median of the distribution, box edges show 1.5× the interquartile range and whiskers extend to 25th and 75th percentiles. c) Clonal fraction of the diploid reference over time. d) Distribution over the probability of positive selection (PPS) over pairs of clones computed as max(P(si > Sj), 1 – P(si > sj)). Purple dots denote PPS over 0.9. e) Mixture experiment of 75% TP53wt (timepoint X28) and 25% TP53−/−b (timepoint X61). f) Observed clonal fractions in the mixture series with diploid, p53wt shown as (WT-F).
