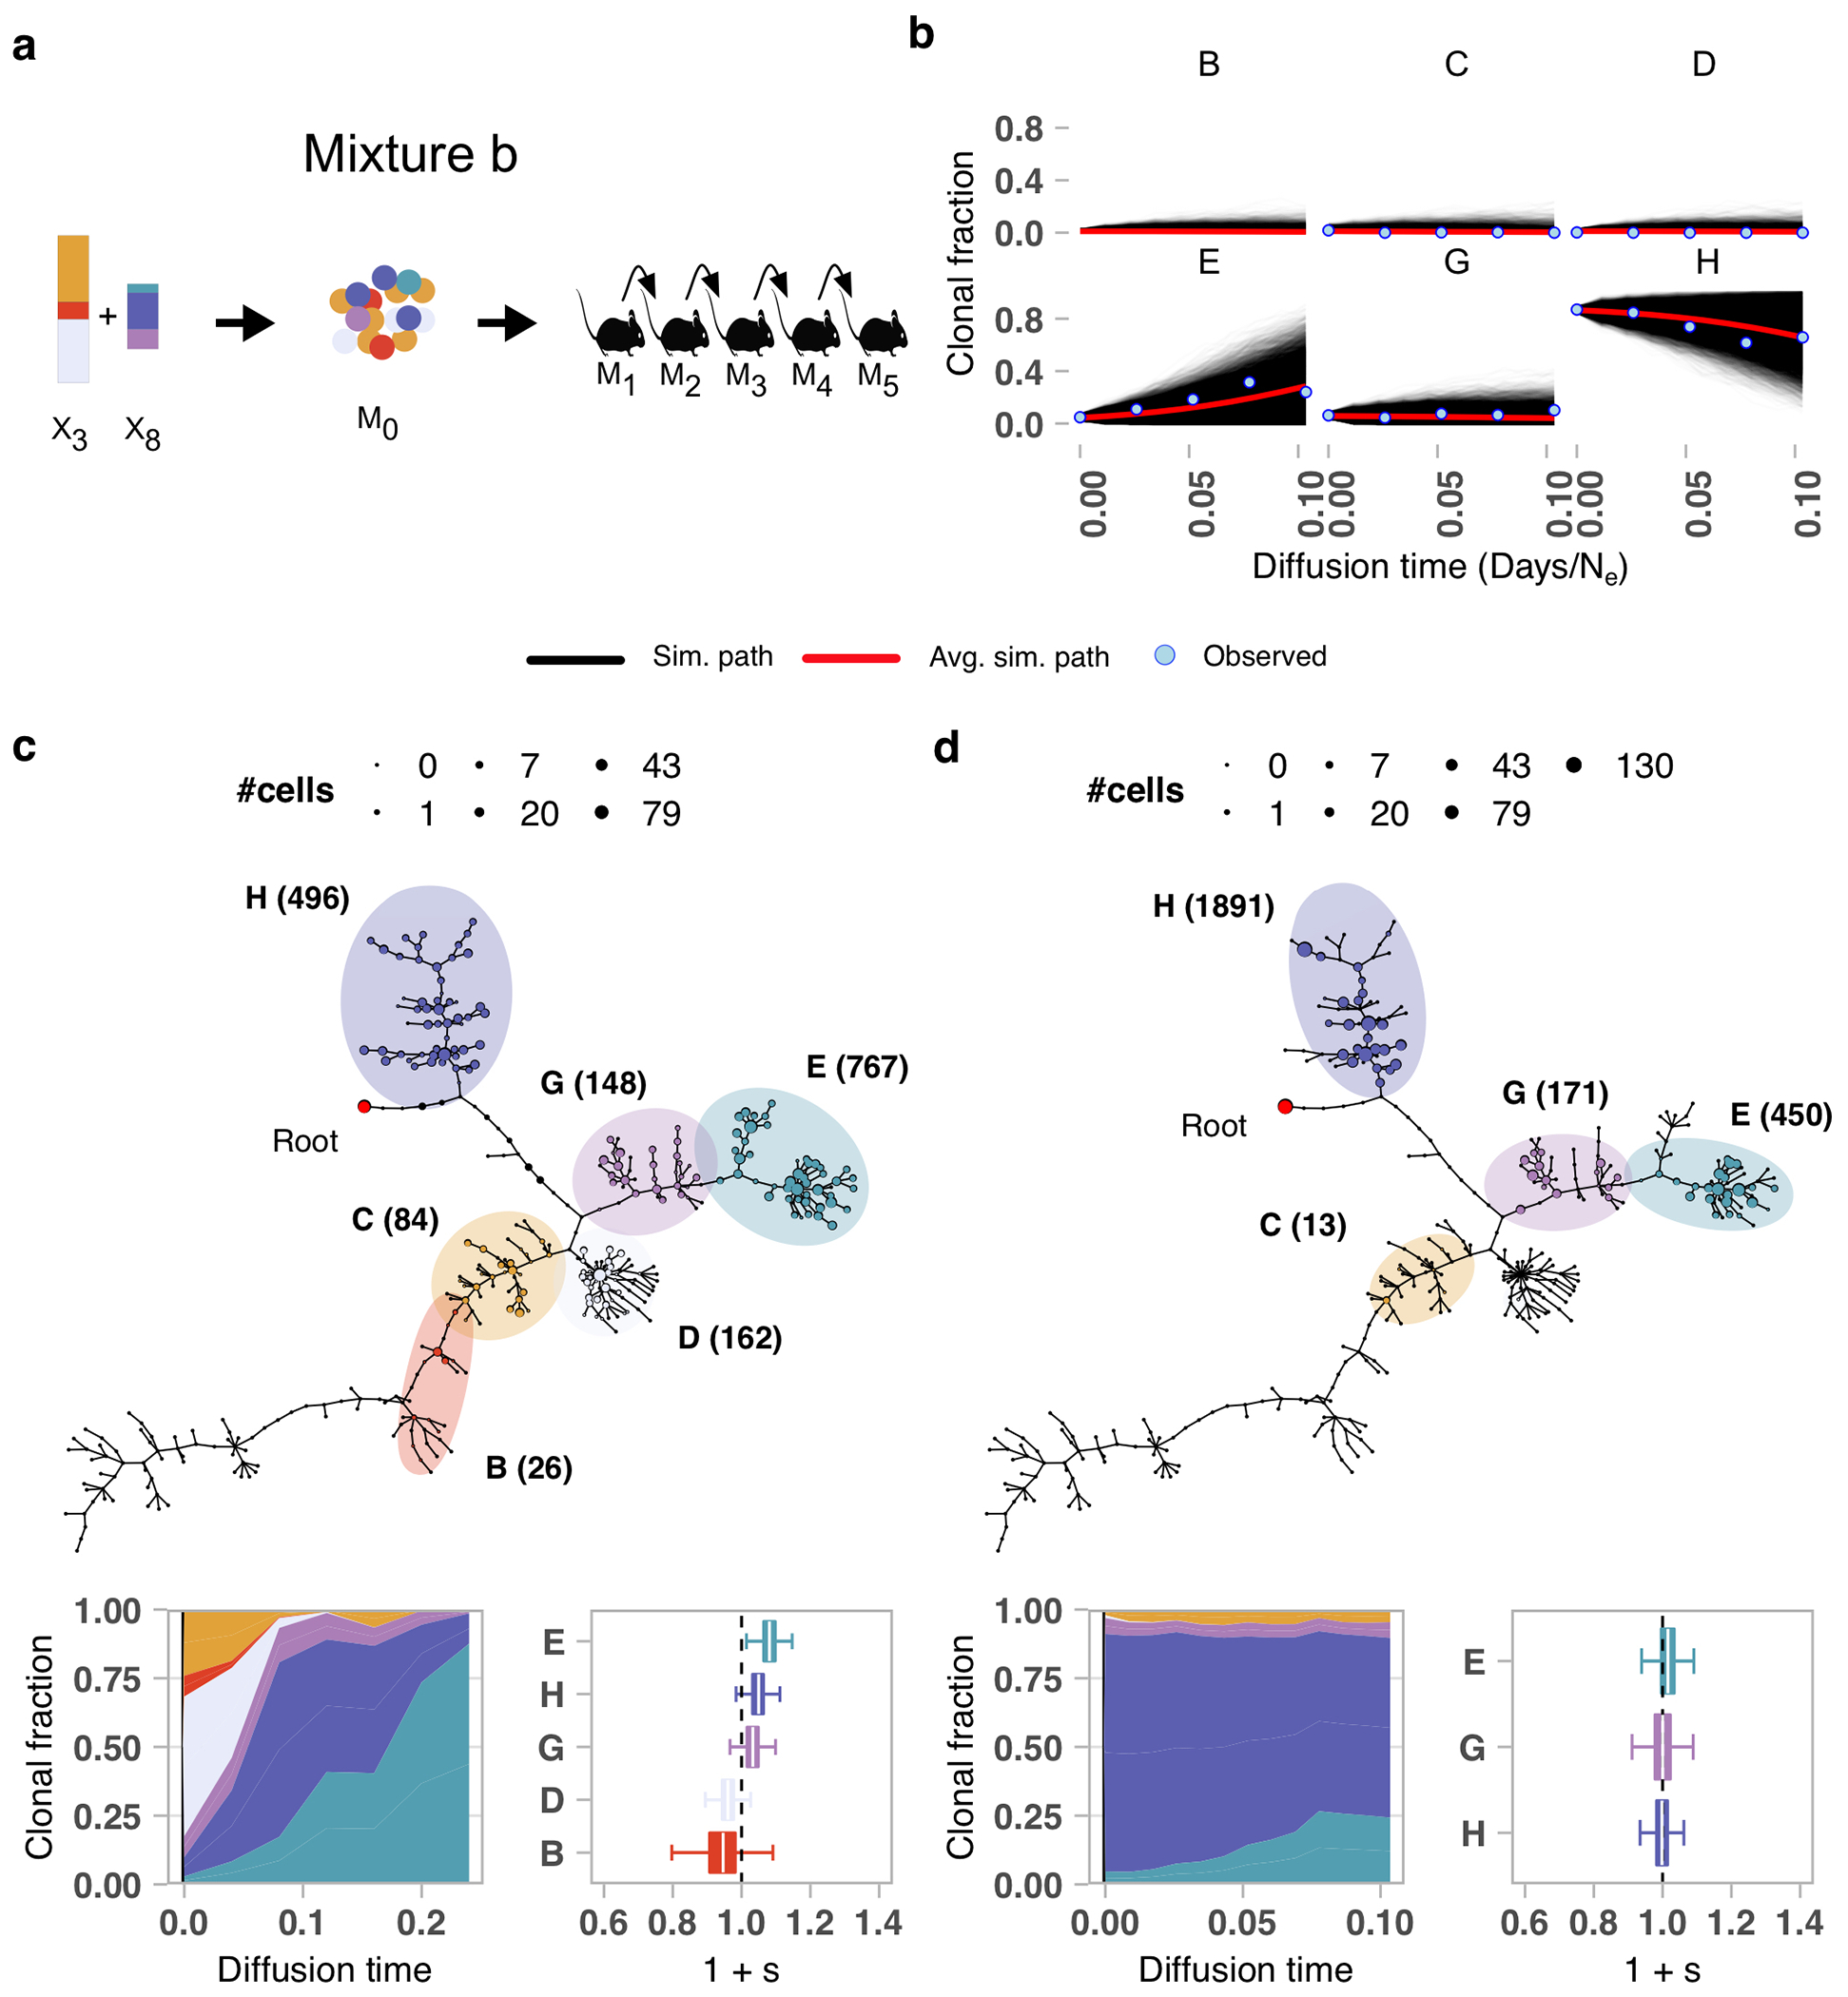
Extended Data Fig. 7.

Mixture experiment in TNBC-SA609 PDX Line 1. a) Clonal proportions of TNBC-SA609 Line 1 X3 and X8 used to generate the initial mixture M0 and subsequent serial passaging, yielding 5 samples for mixture experiment b. b) Forward simulations from the original timeseries and starting population proportions in the initial experimental mixture b. Simulated trajectories are shown superimposed with mean simulation (red line) and observed clonal fractions (blue dots). The observation time is adjusted to match the simulation diffusion time. c) Summary phylogenetic tree, inferred trajectories and fitness coefficients (relative to reference Clone C) for mixture a. d) As in c but for mixture b (relative to reference Clone C). Boxplots are as defined in Fig. 1b.
