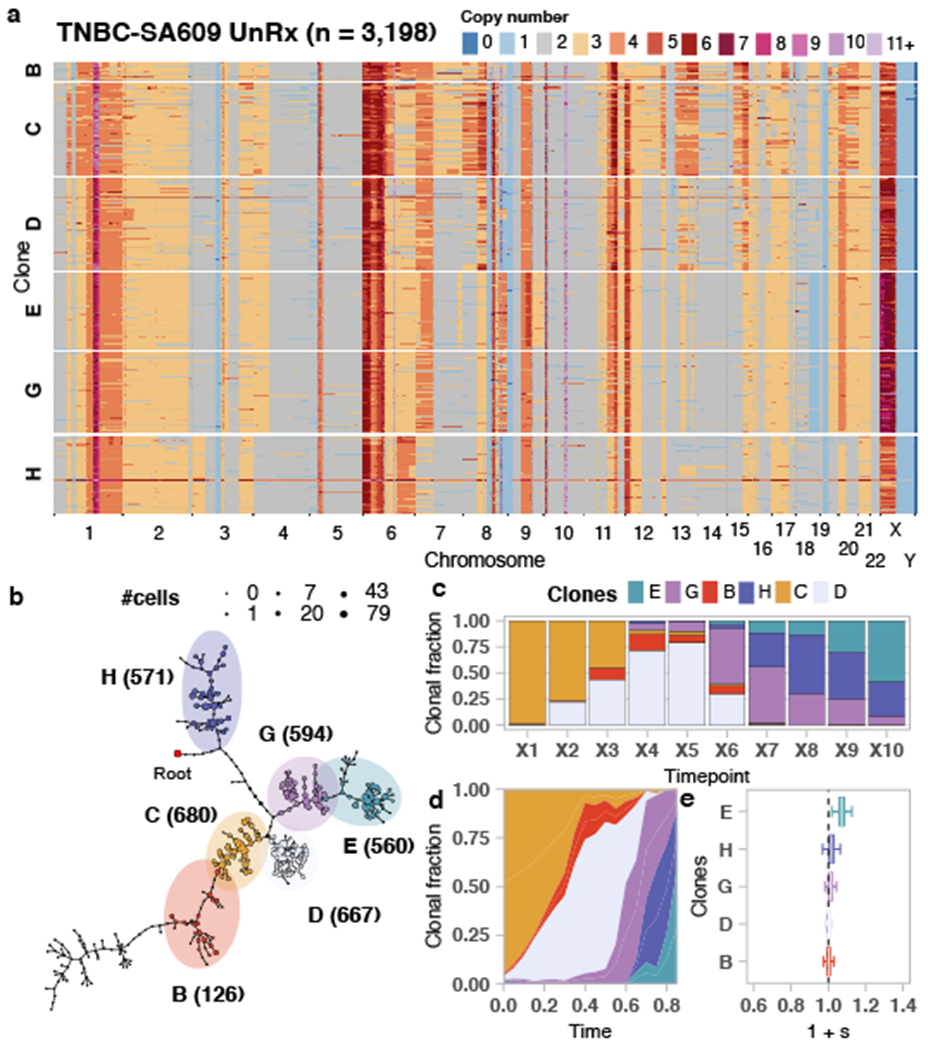
Figure 2.

Fitness landscapes of untreated TNBC-SA609 UnRx PDX. a) Heatmap representation of copy number profiles of 3,198 cells from TNBC-SA609, grouped in 6 phylogenetic clades. b) Phylogeny for TNBC-SA609. c) observed clonal fractions, d) inferred fitClone trajectories and e) quantiles of the selection coefficients with respect to the reference Clone C. Boxplots are as defined in Fig. 1b.
